NBER Reporter Online
NBER Reporter OnLine: 2012 Number 3PDF Version (includes NBER Profiles, Conferences)Previous Issues NBER Program Reports Subscribe to the hard copy NBER Reporter. |
The 2012 Martin Feldstein LectureExecutive Compensation and Corporate Governance in the U.S.: Perceptions, Facts, and Challenges |
Steven N. Kaplan*
In this lecture, I explore some commonly held perceptions of public company executive compensation and corporate governance in the United States: 1) CEOs are overpaid and their pay keeps increasing; 2) CEOs are not paid for performance; and 3) boards are not doing their jobs. For example, Bebchuk and Fried conclude that, "flawed compensation arrangements have not been limited to a small number of 'bad apples'; they have been widespread, persistent, and systemic." 1 I consider the accuracy of these perceptions today, and discuss the implications and challenges that evidence poses for researchers, boards, and shareholders.2
How is pay measured?
There are two ways to measure CEO pay. The first is estimated or grant-date pay. This includes the CEOs salary, bonus, the value of restricted stock, and the estimated value of options issued that year. This is the compensation the board awards the CEO and, therefore, the appropriate measure for of board governance effectiveness. The second measure is realized pay. This includes the CEOs salary, bonus, the value of restricted stock, and the value of options exercised that year. Because it uses actual option gains (not estimated values), this better measures what the CEO actually takes home. Accordingly, realized pay is appropriate for considering whether CEOs are paid for firm performance.
Facts about pay
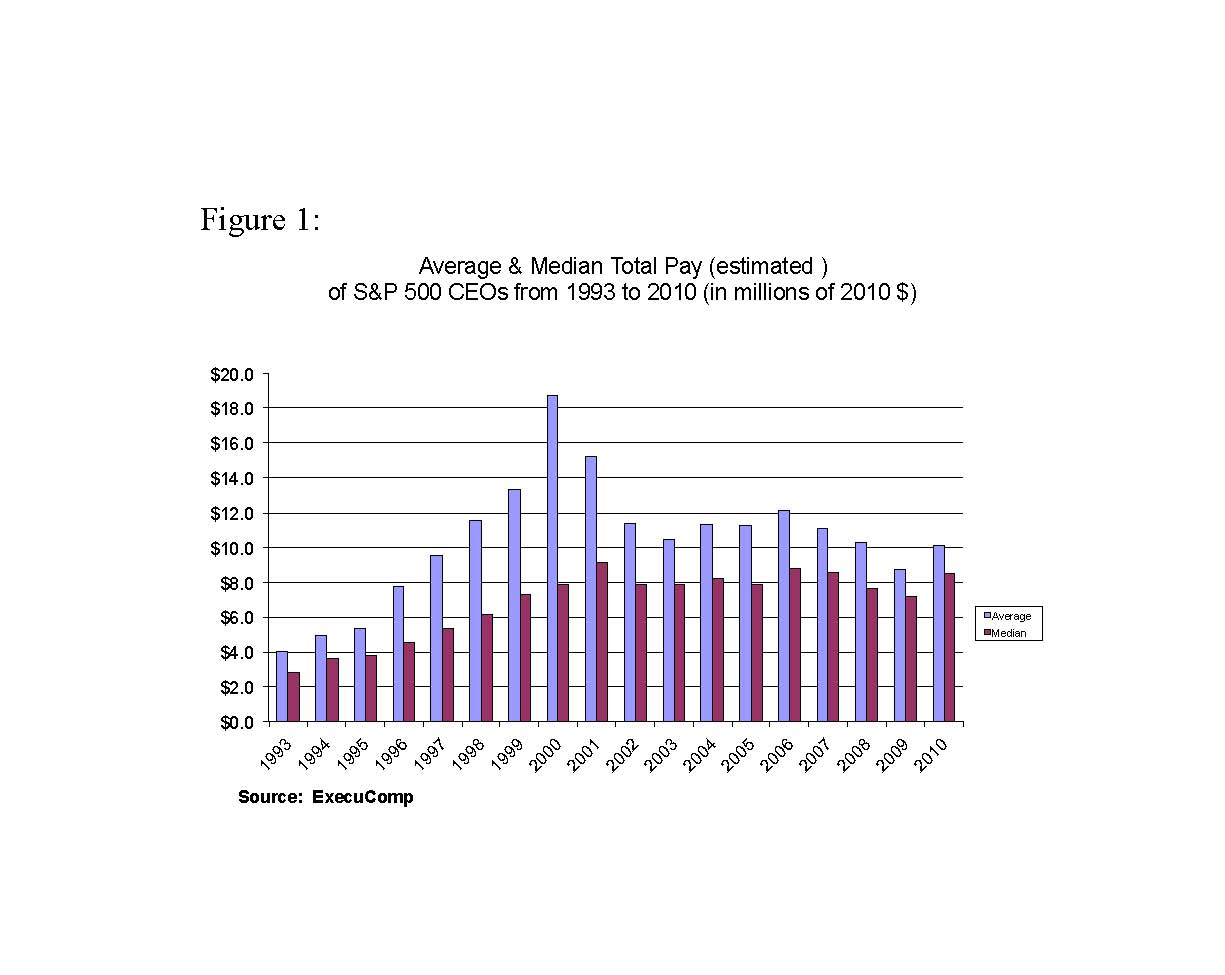
Using estimated pay, I look at data from 1993 to 2010 for S&P 500 companies (from S&Ps ExecuComp database). What has happened to average estimated CEO pay (adjusted for inflation) since 2000? Most audiences believe it has increased substantially. In fact, Figure 1 shows that while average CEO pay increased markedly from 1993 to 2000, it declined by over 46 percent from 2000 to 2010. Median CEO pay also increased from 1993 to 2000, but has since declined. The convergence between the means and medians suggests that boards have become less likely to award large pay packages since 2000.
 (pdf)
(pdf)
There are still some outliers that receive attention and likely drive the perception that pay has increased. For example, three CEOs received over $50 million in estimated pay in 2010. The means and medians indicate that these are outliers and not the general rule.
ExecuComp also follows the CEOs of over 1,000 smaller companies not in the S&P 500. Average estimated pay for these CEOs, like S&P 500 CEOs, increased in the 1990s and declined in the 2000s. Today's average pay roughly equals its 1998 level.
Overall, then, estimated CEO pay what boards expect to pay their CEOs peaked around 2000, both for S&P 500 and non-S&P 500 CEOs. Since then, average estimated CEO pay has declined, returning roughly to its 1998 level.
While average pay has declined since 2000, it remains very high in absolute terms. In 2010, the average S&P 500 CEO received estimated pay of just over $10 million. This is roughly 200 times the median household income in the United States and undoubtedly also contributes to the perception that CEOs are overpaid.
Turnover
The average lengths of CEO tenures today are shorter than in the past. As a result, comparing CEO pay in the 2000s to CEO pay in the 1990s (and earlier) is not an apples-to-apples comparison. In the 1970s, 1980s, and mid-1990s, roughly 10 percent of large U.S. company CEOs turned over each year, not counting takeovers.3 Since 1998, annual turnover has increased to an average of 12 percent, implying a decline in CEO tenure from ten to eight years. Including takeovers, tenures have declined from roughly eight years before 1998 to only six years since.
The decline in tenure implies that the CEOs job has become riskier over time. The shorter expected tenure arguably offsets roughly 20 percent of the increase in CEO pay since the early 1990s 4. The true increase in CEO pay since then is lower than the compensation figures alone would suggest.
How does CEO pay compare to that of other highly paid people?
Gabaix and Landier5 argue that market forces can explain the increases in CEO pay. In a simple competitive model, they show that CEO pay will rise as firms become larger because larger average firm size increases the returns to hiring more productive CEOs. They find empirically that the increase in CEO pay since 1980 can be fully attributed to the increase in large company market values.
Gabaix and Landier, and others6 focus on the market for public company top executives. But the same people also can become executives at private companies, become (or remain) consultants, and, earlier in their careers, become lawyers, investment bankers, or investors. In a competitive market, similarly talented individuals should have done as well as CEOs over the last twenty or thirty years. The large increase in the share of pre-tax income earned by very high earners over that period, documented by Piketty and Saez 7, suggests that this is plausible.
 (pdf)
(pdf)
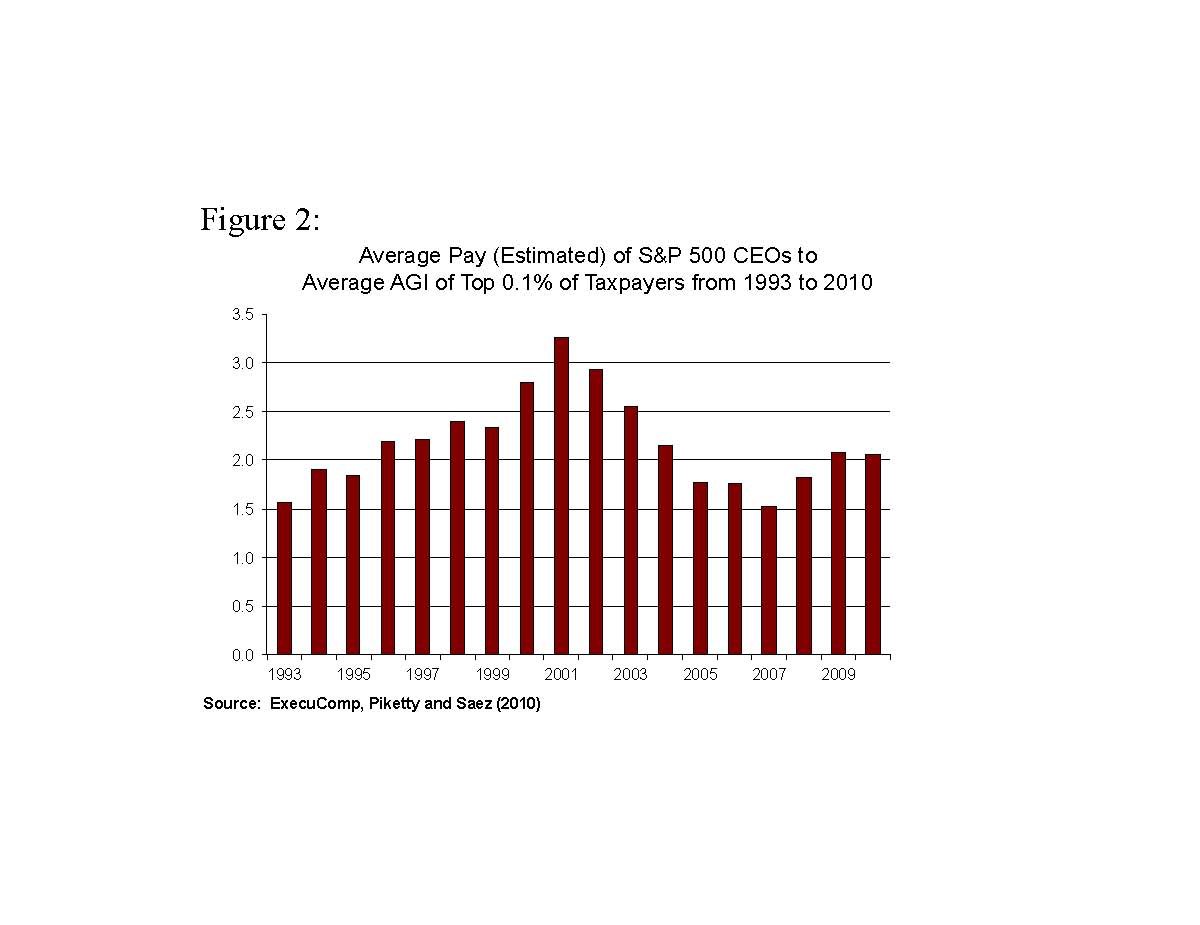
Accordingly, I compare the average estimated pay of S&P 500 CEOs to the average adjusted gross income (AGI) of taxpayers in the top 0.1 percent of the income distribution.8 Figure 2 shows that average estimated pay for S&P 500 CEOs, relative to the average income of the top 0.1 percent, is about the same in 2010 as it was in 1994. S&P 500 CEOs have seen little change in their estimated pay relative to other high earners since the early 1990s. And non-S&P 500 CEOs are worse off relative to the top 0.1 percent than they were in the early 1990s.
Over the last twenty years, then, public company CEO pay relative to the top 0.1 percent has remained relatively constant or declined. These patterns are consistent with a competitive market for talent. They are less consistent with managerial power. Other top income groups, not subject to managerial power forces, have seen similar growth in pay.
What about the longer-term?
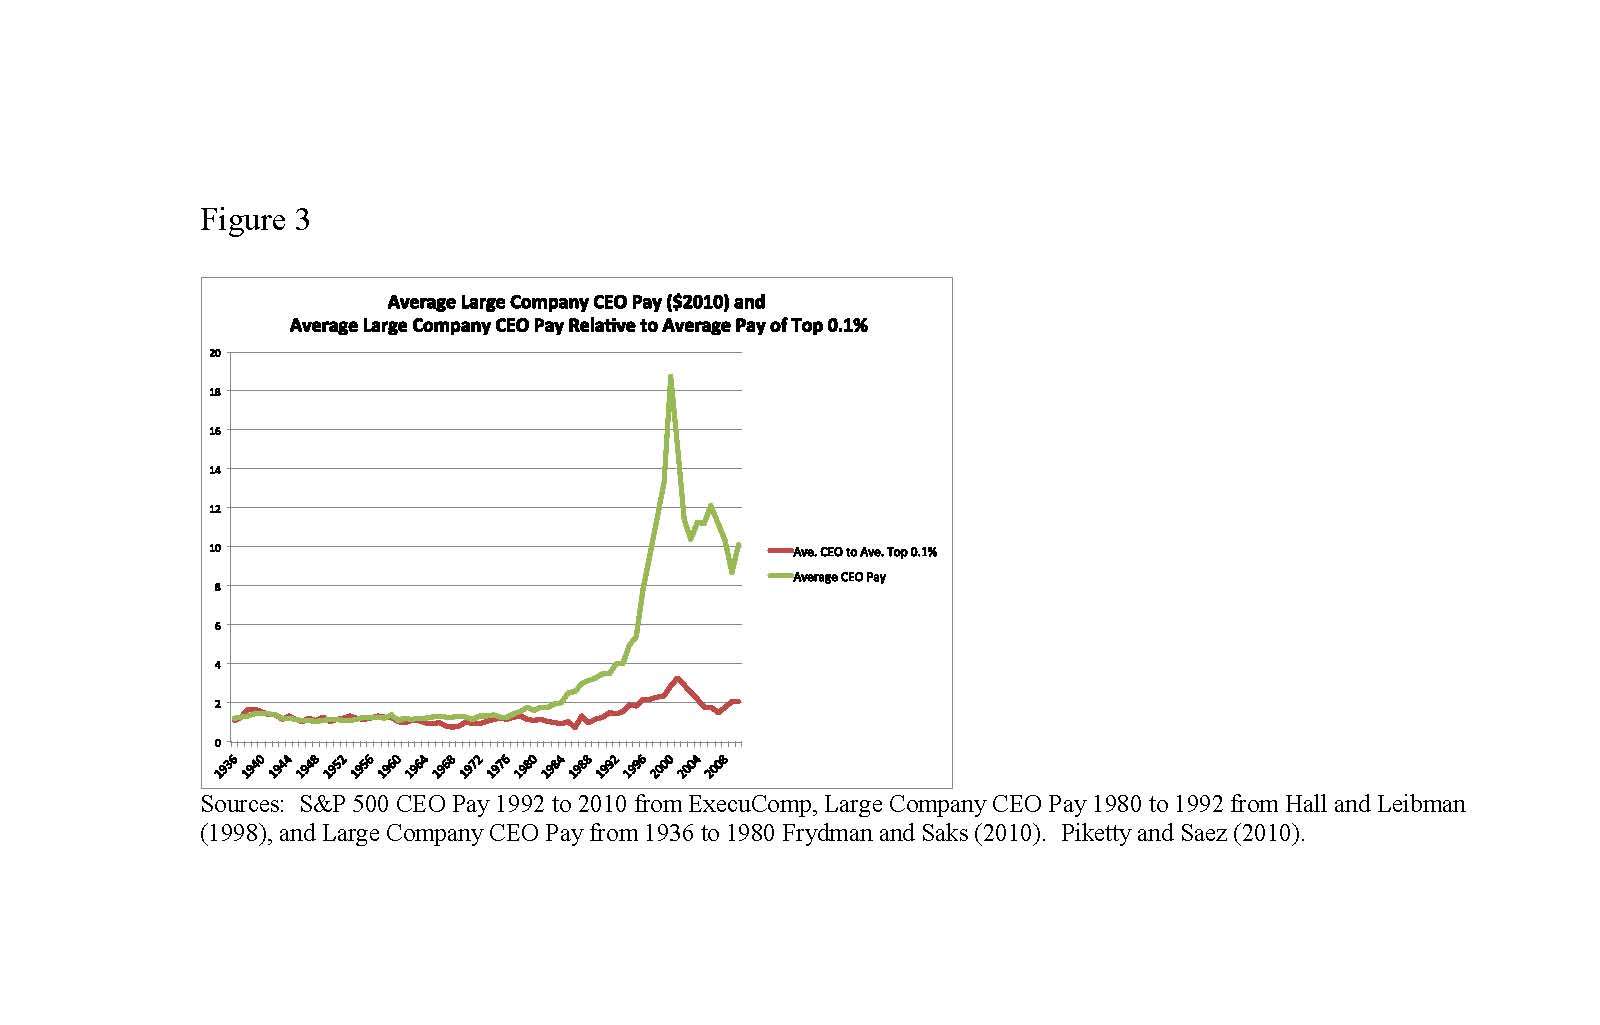
What has happened over the longer-term, since the 1930s? I staple together three data sets of estimated pay ExecuComp data for S&P 500 CEOs from 1992 to 2010, the Hall and Leibman 9 data for large company CEOs from 1980 to 1992, and the Frydman and Saks data for large company CEOs from 1936 to 1980. 10
 (pdf)
(pdf)
Figure 3 shows average estimated CEO pay in 2010 dollars and the ratio of that CEO pay to the average AGI of the top 0.1 percent from 1936 to 2010. While average pay has increased markedly in the last 30 years, the ratio of pay to the top 0.1 percent has increased by much less. The ratio increased from the mid-1980s to the turn of the century. Since then, it has declined, although it remains above its historical average. Interestingly, the ratio in 2007 was lower than the ratio in the late 1930s when dispersed shareholdings and problems of managerial power were presumably less acute than they are today. The unanswered question from these patterns is what drives the fluctuations over time.
 (pdf)
(pdf)
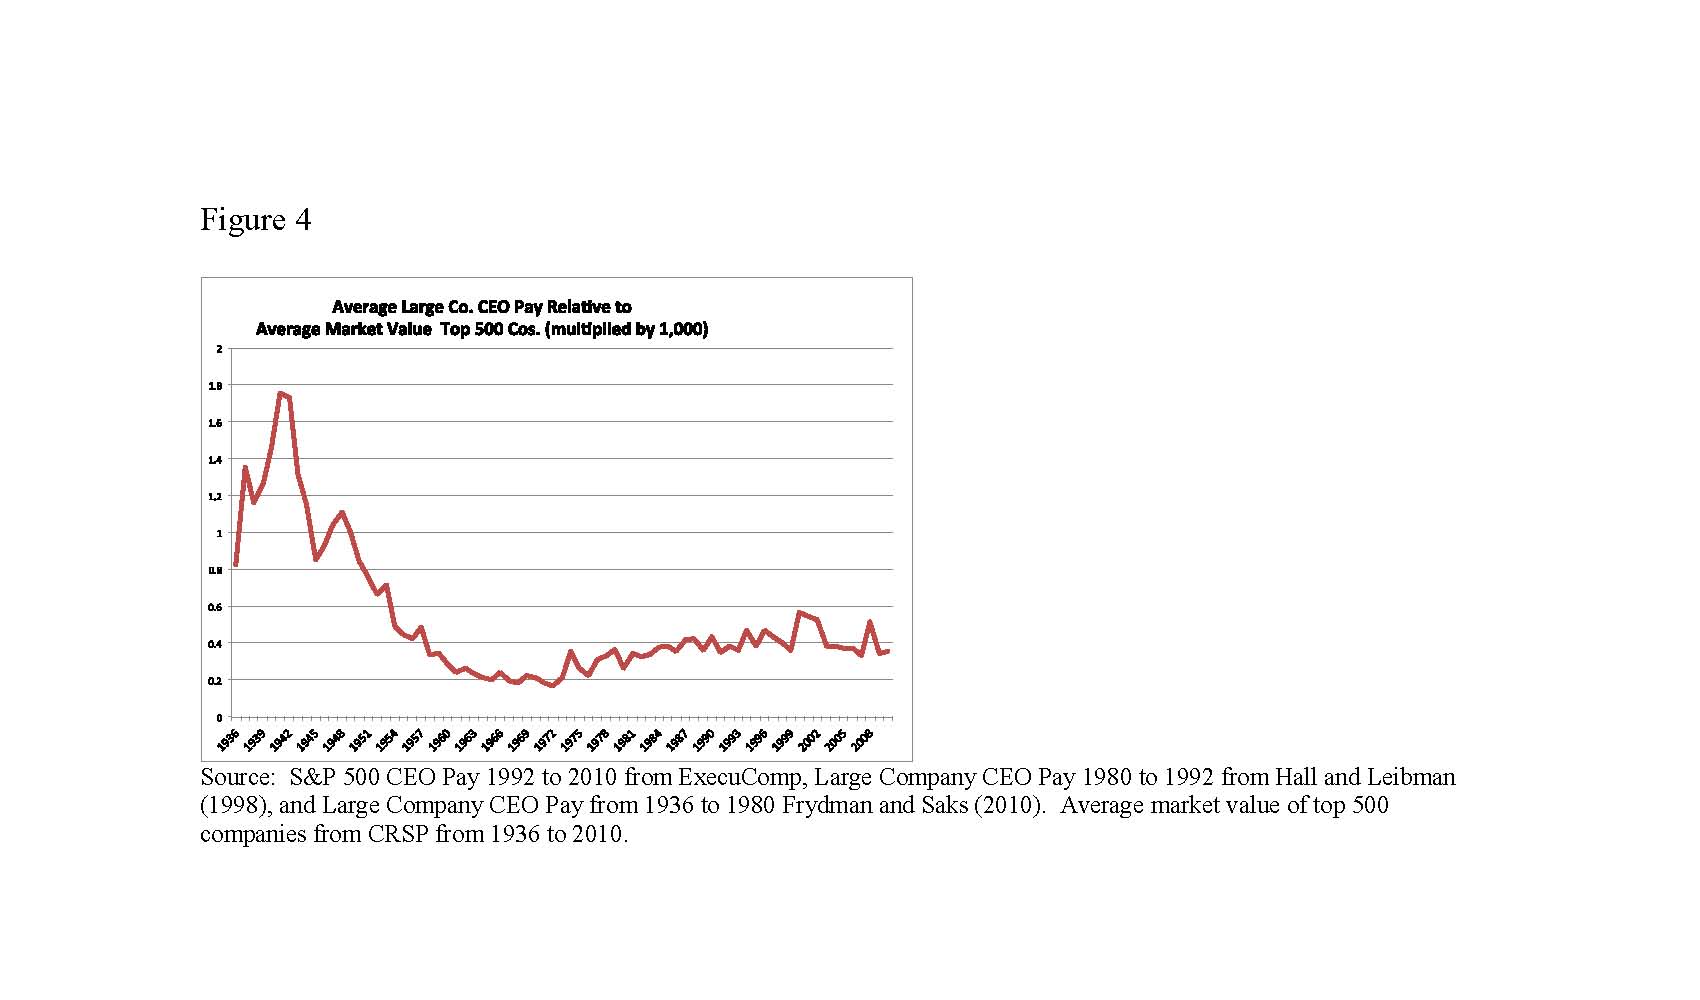
Figure 4 shows the ratio of average estimated CEO pay to the average market value of the top 500 publicly traded companies (multiplied by 1,000). CEO pay was a higher fraction of market value in the 1930s through the 1950s as market values increased much more than CEO pay. The growth rates of market values continued to exceed pay in the 1960s, but pay caught up again by the late 1970s. The ratios increased modestly through 2000, and then declined, returning to their late 1970s (and late 1950s) levels. Since the late 1970s, then, the data generally support the simple Gabaix and Landier story of a competitive market for talent. The unanswered question is why the ratios are so low in the 1960s and so high in the 1930s and 1940s.
Taken together, these long-run patterns suggest that a combination of the market for talent and firm scale have been meaningfully associated with large company CEO pay over a long period of time.
Other specific groups
The previous analyses compare public company CEOs to those in the top income brackets. Public company CEO pay can also be compared to the pay of specific groups in those brackets that have similar opportunities or talents, particularly non-public company executives, lawyers, and investors.
Bakija Cole and Heim 11 study IRS tax return data between 1979 and 2005. They try to compare public and private company executives by distinguishing those who receive the majority of their income in salary and wages from those who receive the majority from self-employment. The former are more likely to include public company executives; the latter, executives of closely-held businesses.
The pay of closely-held firm executives increased by more than the pay of salaried executives from 1979 to 2005. Closely-held firm executives also increased their representation in the top 0.1 percent, increasing from 9 percent in 1979 to 22 percent of the top 0.1 percent in 2005. Over the same period, the representation of salaried executives declined from 38 to 20 percent.
Public company executives, those who should be more subject to managerial power problems, saw their pay increase less than executives of closely-held company businesses which are, by definition, controlled by large shareholders or the executives, and are subject to limited agency problems. This is notable because many of the salaried and closely-held executives likely come from the same executive pool and, presumably, can move between public and private company employment.
What does this mean?
The point of these comparisons is to confirm that while public company CEOs earn a great deal, they are not unique. Other groups with similar backgrounds and talents private company executives (as well as corporate lawyers, investors and others) have seen significant pay increases where there is a competitive market for talent and no managerial power problems exist. If one uses evidence of higher CEO pay as evidence of managerial power, one must also explain why these other groups have had a similar or higher growth in pay. Instead, it seems more likely that market forces have drive a meaningful portion of the increase in public company CEO pay.
Josh Rauh and I concluded that some combination of changes in technology, along with an increase in the scale of enterprises and finance, have allowed more talented or fortunate people to increase their productivity relative to others. This seems relevant for the pay increases of lawyers and investors (technology allows them to acquire information and trade large amounts more efficiently) as well as CEOs (technology allows them to manage very large global organizations).12
Pay for Performance
Do CEOs who perform better earn more in realized pay -- which includes option exercises and better measures what the CEO actually takes home? For each year from 1999 to 2004, Josh Rauh and I took the firms in the ExecuComp database and sorted them into five size groups. Within each size group for each year, we sorted the CEOs into five groups based on realized pay. We then looked at how the stocks of each group performed relative to their industry over the previous three years.
Realized compensation was highly related to firm stock performance. In every size group, firms with CEOs in the top quintile of realized pay were in the top performing quintile; firms with CEOs in the bottom quintile of realized pay were in the worst performing quintile.
Frydman and Saks study the correlation between an executives wealth and firm performance. They find that CEO wealth has been strongly tied to firm performance since the 1930s, and that relationship strengthened considerably after the mid-1980s.
The evidence, then, is consistent with realized CEO pay and CEO wealth being strongly tied to firm performance. The more difficult question is how much pay-for-performance is optimal, and whether current practices can become more efficient. Some argue that pay-for-performance is too low and should be increased. Others argue that some pay-for-performance incentives, particularly in financial services, are too high.
Are CEOs fired for poor performance?
CEO turnover levels have increased since the late 1990s, so CEOs can expect to be CEOs for less time than in the past. CEO turnover also has become increasingly related to poor firm stock performance.13 This suggests boards and the corporate governance system having performed better in their monitoring role since the 1990s.
Jenter and Llewellen14 present additional evidence consistent with this. They look at CEO turnover in ExecuComp firms from 1992 to 2004 and find "that boards aggressively fire CEOs for poor industry-adjusted performance, and that the turnover-performance sensitivity increases substantially with higher quality boards." In the first five years of their tenure, CEOs who perform in the bottom quintile relative to their industry are 42 percent more likely to depart than top quintile CEOs. This spread increases to more than 70 percent for firms with higher quality boards more independent boards with greater stock ownership. As with pay-for-performance, the more difficult question is whether these differential departure rates are optimal and whether current practices can be improved.15
What do shareholders think?
It would be useful to know what shareholders think. Fortunately, the Dodd-Frank Act of 2010 mandated that most publicly traded-firms hold Say-on-Pay votes non-binding shareholder votes on the compensation of their top five executives. Say-on-Pay supporters believed that the votes would reduce the perceived CEO pay spiral and would increase pay for performance. Under the alternative view that pay levels and pay-for-performance are largely determined in a competitive market, the Say-on-Pay votes would be a non-event.
The law went into effect in 2011. The votes were overwhelmingly in favor of existing pay policies: roughly 98 percent of companies received majority support of their shareholders; more than 73 percent of companies received a favorable vote above 90 percent. The 2012 votes have followed a qualitatively similar pattern. The positive shareholder votes for most companies seem inconsistent with top executive pay being driven largely by managerial power. Rather, the votes are consistent with a more market-based view.
How have public companies in the U.S. performed?
Given the negative perceptions of CEO pay and corporate governance, one would think that corporate performance has been poor. The U.S. economy has gone through a financial crisis and recession, and the S&P 500 has declined from a peak of 1576 in 2007 to roughly 1400 today (August 2012). At the same time, CEO pay has declined. What has happened to operating performance?
S&P 500 companies have weathered the downturn surprisingly well. Median operating margins (EBITDA to Sales) increased from 1993 to 2007 and increased again, to their highest level in the period, from 2007 to 2011.17 The National Income and Product Accounts, while they include public and private companies, also show that corporate profits as a fraction of GDP are at historically high levels. On average, then, particularly for non-financial companies, average operating performance has improved while average compensation has declined.
Summary
To summarize, I have considered the evidence for three common perceptions of U.S. corporate governance. The evidence is somewhat different from those perceptions.
While average public company CEO pay increased substantially through the 1990s, it has since declined. CEO pay levels relative to other highly paid groups today are comparable to or lower than their average levels in the early 1990s although they are still above the long-term historical average. The ratio of large-company CEO pay to firm market value is similar to its levels in the late 1970s and late 1950s, and lower than its earlier levels.
Furthermore, CEOs are typically paid for performance and penalized for poor performance. And finally, boards do monitor CEOs, and that monitoring appears to have increased over time. CEO tenures in the 2000s are lower than in the 1980s and 1990s, and CEO turnover is tied to poor stock performance.
In his 2012 work, Murphy concludes that executive compensation is affected by the interaction of a competitive market for talent, managerial power, and political factors. That conclusion is hard to disagree with.
There have been corporate governance failures and pay outliers where managerial power surely has been exercised. And, CEO pay today is still extremely high relative to typical household income. At the same time, a meaningful part of CEO pay appears to have been driven by the market for talent. In recent decades, CEO pay is likely to have been affected by the same forces of technology and scale that have led to the general increase in incomes at the very top.
* This is a written and abbreviated version of the Martin Feldstein Lecture given on July 10, 2012. Kaplan is an NBER Research Associate and the Neubauer Family Distinguished Service Professor of Entrepreneurship and Finance, University of Chicago Booth School of Business. He also serves on public company and mutual fund boards. Douglas Baird, Effi Benmelech, Carola Frydman, Austan Goolsbee, Jeff Miron, Lawrence Mishel, Raghu Rajan, Amir Sufi, Luke Taylor and Rob Vishny provided helpful comments on this article.
1. L. Bebchuk and J. Fried, Pay without Performance: The Unfulfilled Promise of Executive Compensation, Harvard University Press, (2006).
2. My talk addresses these perceptions. It is based on the more detailed treatment in my Executive Compensation and Corporate Governance in the U.S.: Perceptions, Facts and Challenges, Cato Papers in Public Policy, forthcoming. Two excellent and recent surveys, "Executive Compensation: Where we are, and how we got there", Kevin J. Murphy, forthcoming in Handbook of the Economics of Finance, G. Constantinides, M. Harris, and R. Stulz, eds., and "CEO Compensation", C. Frydman and D. Jenter, Annual Review of Financial Economics, 2(2010), pp. 75-102, provide broader analyses and summaries of corporate governance issues.
3. See K. J. Murphy and J. Zábojník, Managerial Capital and the Market for CEOs, 2008, and S. Kaplan and B. Minton, "How has CEO Turnover Changed?" International Review of Finance, 12 (2012), pp. 57-87.
4. F. Peters and A. Wagner, "The Executive Turnover Risk Premium", working paper, Swiss Finance Institute, 2012, which estimates this explicitly and finds that a 1 percent increase in turnover risk is associated with a 10 percent increase in pay.
5. X. Gabaix and A. Landier, "Why Has CEO Pay Increased So Much?" NBER Working Paper No. 12365, July 2006, and Quarterly Journal of Economics, 123(1) (2008), pp. 49100.
6. See C. Frydman and R. E. Saks, "Executive Compensation: A New View from a Long-Term Perspective, 19362005", Review of Financial Studies 23, (2010), pp. 2099-138, and Murphy and Zábojník, 2008, op. cit.
7. T. Piketty and E. Saez, "Income Inequality in the United States, 1913- 1998", NBER Working Paper No. 8467, September 2001, and Quarterly Journal of Economics 118 (2003), pp. 1-39. (Tables and Figures updated to 2010 in Excel format, March 2012).
8. This updates and expands the analysis in S. Kaplan and J. Rauh, "Wall Street and Main Street: What Contributes to the Rise in the Highest Incomes?" NBER Working Paper No. 13270, July 2007, and Review of Financial Studies 23, (2010), pp.1004-50.
9. B. Hall and J. Liebman, "Are CEOs Really Paid Like Bureaucrats?" NBER Working Paper No. 6213, October 1997, and Quarterly Journal of Economics, 113 (1998), ppp.65391.
10. I thank Carola Frydman for providing them.
11. J. Bakija, A. Cole, and B. Heim,"Jobs and Income Growth of Top Earners and the Causes of Changing Income Inequality: Evidence from U.S. Tax Return Data", Working paper, Indiana University, 2012.
12. See J.A. Parker and A. Vissing-Jørgensen, "The Increase in Income Cyclicality of High-Income Households and its Relation to the Rise in Top Income Shares", Brookings Papers on Economic Activity, Fall, 2010, pp.1 70, for a concurring view.
13. See Kaplan and Minton, 2012, op. cit.
14. D. Jenter and K. Lewellen, "Performance Induced CEO turnover", Working Paper, Stanford University 2010.
15. See L.A. Taylor, "Why are CEOs Rarely Fired? Evidence from Structural Estimation", Journal of Finance 65(6) (2010), pp. 2051-87, for an attempt at estimating this.
16. See S. Mishra, "Parsing the Vote: CEO Pay Characteristics Relative to Shareholder Dissent", working paper, Institutional Shareholder Services, 2012.
17. See also "For Big Companies, Life Is Good," Scott Thurm, Wall Street Journal, April 8, 2012.