NBER Reporter: Summer 2000
Technology and the Stock Market
This article reviews my work on the relationship between technological change and the stock market. My co-authors in this area are Jeremy Greenwood, Bart Hobijn, and Peter L. Rousseau. The papers that we have written so far are listed at the end of this article.
Creative Destruction in the Stock Market
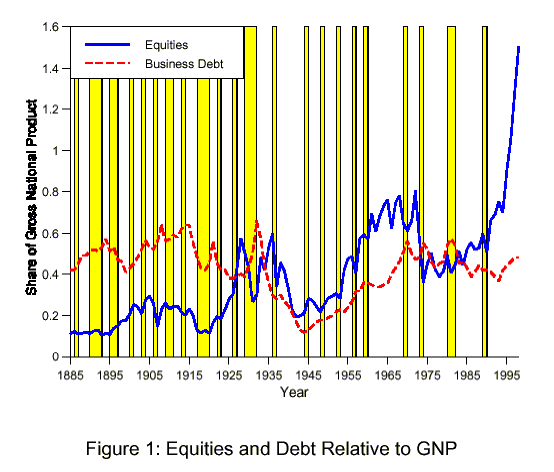
Figure 1 shows that U.S. stock market capitalization has risen relative to GNP by a factor of about 12 over a 113-year period. On the other hand, business debt -- bank loans and corporate bonds -- begins and ends the period at about 40 percent of GNP, which implies that the debt-equity ratio has fallen by a factor of 12.

Although the long-run shift is out of debt and into equity, in the medium run equity and debt move together, which means that the waves in the stock market are not the result of shifts between the two modes of finance. Figure 1 also shows the official NBER recession dates, which are about as likely to appear when the stock market is low as when the stock market is high relative to GNP.
Can technological progress explain some of the medium-run swings in the stock market? I would argue that a "stock market wave" forms when major invention triggers a process of Schumpeterian creative destruction in technologies, in products, and (most relevant here) in firms. Briefly, what happens is: a new technology signals the end of an era, and the signal is bad news for the stock market incumbents. Large firms -- the companies that account for the lion's share of the stock market capitalization -- are good at routine innovation and good at improving methods they use and products they sell, but in small ways, a step at a time. The corporation thrives under "business as usual" conditions; in times of change, it is held down by ignorance, outdated training, and the vested interests of its employees. Its stock price then will fall if investors fear that the equipment and techniques it uses soon will be obsolete and that it will resist the new technology. The corporation's very survival may require a major overhaul, and current management may not be up to the task. The market drops until a wave of new entrants causes it to rise again. Inventions such as computers tend to be developed in small, privately held companies. These inventions do not add any value to the stock market until the small companies go public or are acquired. Thus, technological progress destroys values of old firms, and only later leads to stock-market entry and to a boost in productivity and earnings.
The Post-1973 Wave
Greenwood and I argue that the J-shaped post-1973 wave is an example of just such a process. By late 1972, Intel had developed its second computer chip. Within two years there existed affordable personal computers that, in spite of lacking a screen and keyboard, could be used by a capable programmer to do calculations that earlier would have required the use of a mainframe computer with queues, delays, and so forth. Investors thus should have been aware of the potentially rapid progress in computing power. So, while the information technology (IT) revolution was gathering momentum in the 1970s, stock prices fell; some companies went out of business, and some declined. Total market capitalization dropped from 113 percent of GDP in 1968 to 45 percent of GDP in 1974 and remained there for the next ten years. The price-earnings ratio on the S&P 500 Index fell from 19.5 in December 1972 to 7.5 two years later. Stocks that would later gain from the IT boom were not yet quoted; Microsoft, for example, only had its initial public offering (IPO) in 1986, and, as other IT developers started going public and growing in the 1980s, Wall Street surged. By 1996, the market's value was 132 percent of GDP. Older companies, those traded on major stock markets in 1968, accounted for less than one-fifth of the 1981 to 1996 rise in market capitalization.
Hobijn and I offer several reasons why the shock that caused all this was indeed IT, and why, as far back as 1973, the market probably did predict future developments well. First, the hardest-hit stocks in 1973-4 were those in IT-intensive sectors. Services' stocks did worse than many manufacturers. Second, if expectations of an IT boom were to blame for the crash, one would expect households to have saved less in anticipation of higher future incomes. And this is exactly what they did: lower equity wealth should have reduced consumption, but wealth instead was being created in garages and other places that the stock market does not measure; on those grounds consumption should have risen, and it did. Third, the alternative explanations for the post-1973 crash, such as the oil shock and negative surprises to old technologies, are implausible. The oil shock explanation does not make theoretical sense because such shocks should have hit current earnings harder than future earnings, and the capitalization-GNP ratio should have risen, not fallen as it did. Moreover, even in the early 1970s, oil was too small a fraction of costs to have much effect on dividends; what is more, the stocks in oil-intensive sectors were not hit any harder than other stocks. Finally, a negative technological shock does not make sense either. Technological surprises really make sense only when they are positive and about a new technology, like the microprocessor chip. Old technologies are too well understood to produce the sort of negative surprise that would explain a market drop of the magnitude we saw in 1973-4.
The Disciplining Role of M&As
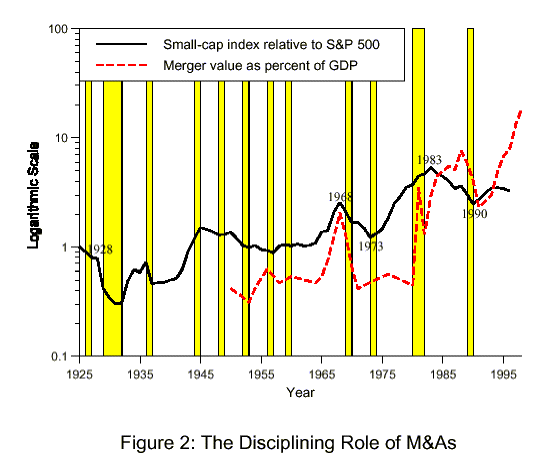
Theory says that the stock market is a good thing because it allows an inefficient firm to be taken over and managed better; that is socially cheaper than forcing the firm out through the entry of more efficient competitors. Figure 2 shows the ratio of the Ibbotson small-cap index to the S&P 500 Index. At high frequencies, we observe what we may have expected: Recessions are worse for small-cap stocks than they are for the S&P 500 Index -- in only 3 out of the 12 recessions did the ratio of the two indexes rise. But recessions are uncorrelated with the medium-run shifts, and our interest is in the period immediately following the arrival of the microprocessor. During 1974-82, small-cap stocks outperformed the S&P 500 Index by a factor of nearly four, probably because the larger firms resisted the new technology.

If this signaled an inefficiency on the part of large firms, then theory says that takeovers should have followed. According to the dashed line in Figure 2, this is exactly what happened. As a fraction of GDP, mergers and acquisitions surged in 1980. There followed a wave of hostile takeovers in which a new instrument, the "junk bond," was an effective financing tool. The large firm has bounced back since the early 1980s. One suspects that the junk bond was a response to the falling valuation of the large firm. More generally, mergers seem to occur after large firms lose value -- tests for 1950-96 show the solid line Grainger-causing the dashed line at the 5 percent level. In any event, the junk-bond era dawns in the early 1980s, and it ends in the leveraged buyout of RJR Nabisco by Kohlberg Kravis Roberts; it bought the company for $24.5 billion in cash and debt in 1989, the same year that Congress denied the tax deduction on junk-bond interest payments. But the S&P 500 Index has done better since the mid-1980s, and by 1990 the ratio of the two indexes was back where it had stood in 1968. Large firms apparently had managed to adapt to the new IT era, not only thanks to a greater threat of takeover, but also perhaps to the increased use of management stock options and to other incentives for managers to act in the shareholders' interest. Moreover, today's giants probably do better because they are much younger than they used to be: Microsoft, Cisco, MCI, and Dell, for example, were all incorporated in the last two decades.
Lessons from the Jazz Age
What date in the electrification era corresponds to today? One way to date things is by how far a technology has spread among American households and businesses. Today, roughly 50 percent of households own a personal computer (PC). The corresponding date in the diffusion of electricity was 1924. So, to learn what will happen to the wave of IT upstarts that "IPO'd" in recent years, one can look at what happened to the wave of 1920s entrants, or what Rousseau and I call the "Jazz Age vintage." The 1920s are like the present because both are epochs of widespread adoption of revolutionary technologies: in the 1920s it was electricity and the automobile; today it is the PC and the Internet. The 1920s spawned the secondary wave of electricity-era entrants that brought in the products that the newly electrified factories and households demanded. The new firms issued patents that surged in the teens and 1920s, just as they are surging now.
Our findings do not support the conventional view of the 1920s as an era of misguided optimism that ended with a crash and depression. Hindsight shows that the New York Stock Exchange firms of the 1920s were somewhat overvalued, but this overvaluation was concentrated among the then-old economy. Moreover, the stock market exit rate was low during the Depression -- one does not see an "echo" exit effect in the 1930s following the great wave of entry of the 1920s. The 1920s entrants had staying power. Figure 2 shows that small-cap stocks declined about two or three times as sharply as large-cap stocks, but they recovered slowly, and their recovery was led by the Jazz Age cohort. At the end of it all, the firms that went public between 1918 and 1934 did much better than the adjacent vintages.

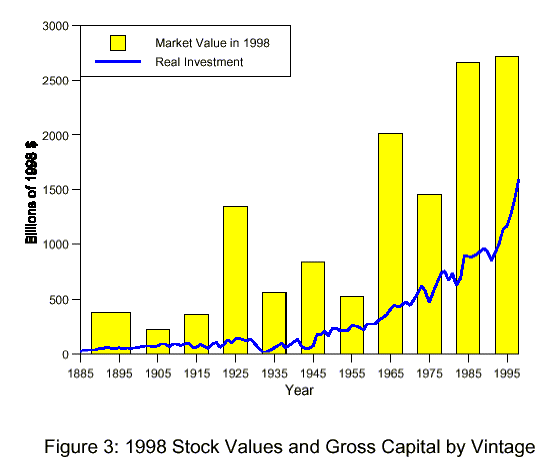
Figure 3 shows the 1998 worth of eleven vintage portfolios -- what each decade-cohort was worth by 1998. The cohort of the 1920s accounts for nearly $1.5 trillion of 1998 stock market value -- far more than any decade-cohort before the 1960s. Indeed, the 1920s vintage accounts for almost as much value as the 1970s vintage, even though nearly four times as much was invested in the 1970s (see the dark line -- presumably investment in the 1970s was biased towards the pre-1970s vintage firms). The companies that went public in the 1920s were then the New Economy. The Jazz Age firms did very well later in spite of the crash of 1929 and the ensuing Great Depression; that suggests that they were selling good products and using good technologies, qualities that enabled them to ride out the hard times they had to face in their infancy. Indeed, the experience of the 1920s suggests that the survivors among today's Internet cohort will not only make up for the losers, but also will do so to an extraordinary extent.
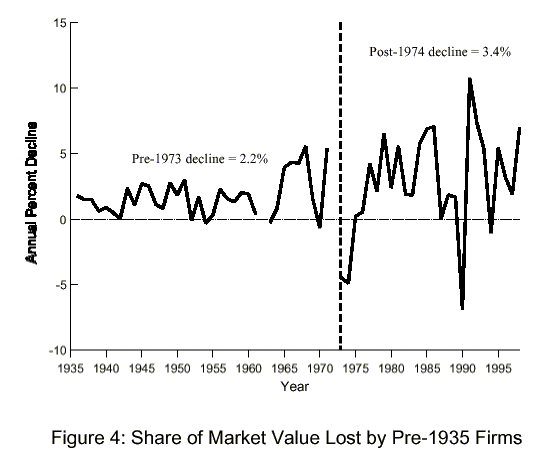
How long will this new prosperity last? Again, let us look to the past for the answer. The last time we had a sweeping technological transformation was when electricity and the internal combustion engine were commercialized, roughly the 45-year period from 1890-1935. What is the survival record of the Jazz Age stock market entrant, and, to be specific, how long did the pre-1935 companies continue to thrive? Figure 4 tries to answer this question by plotting the share of the stock market that the pre-1935 vintages lost each year. The figure shows that until the early 1970s these companies were losing market share at a rate of only 2.2 percent per year. After 1974, however, the rate of loss jumps to 3.4 percent per year.

The higher rate of loss probably was caused by the inability of the Jazz Age and earlier vintages to absorb the next major technological wave -- the PC and IT -- as well as the new generations of firms could. The current prosperity should continue until the next big technology arrives. If history were to repeat itself, the next major technology would arrive in the year 2040, and we could expect a decline then in the performance of today's IT leaders.
The Next Stage: The Transition from Steam to Electricity
The 113 years of U.S. stock market data carry a lot of information, but they still cover just two industrial revolutions -- the electricity-diesel era and the IT era -- and hence just one transition from an old economy to the new. The U.S. stock market is rather thin before 1900 and is dominated by railway stocks. The London stock market was much broader, and we plan to study it as far back as the 1820s, the start of the railway era. These data will tell us more about how the steam engine gave way to electricity and diesel. Rousseau and I are gathering these data now so that we can take an even longer view and learn more about how technology and the financing process interact.
References
1. J. Greenwood and B. Jovanovic, "The Information-Technology Revolution and the Stock Market," American Economic Association (Papers and Proceedings), 89(2) (May 1999), pp. 116-22.
2. B. Hobijn and B. Jovanovic, "The Information-Technology Revolution and the Stock Market: Preliminary Evidence," NBER Working Paper No. 7684, May 2000.
3. B. Jovanovic and P. L. Rousseau, "Accounting for Stock Market Growth: 1885-1998," NBER conference paper, June 2000.