NBER Reporter: Research Summary Spring 2004
Housing Supply
Edward L. Glaeser(1)
In 1981, Lawrence Summers noted the 35 percent increase in real housing prices between 1965 and 1980 and argued that this increase could be explained by inflation. Summers(2) and Poterba(3) persuasively showed that higher levels of inflation increase the interest rate subsidy on home mortgages and essentially shift out the demand curve for housing. Ten years later, Mankiw and Weil(4) argued that demographics drive housing demand and, because of falling demand, housing prices will experience painfully slow growth by the year 2000.
The appropriate renown of these papers indicates the degree to which demand-side analysis has dominated the housing literature, but an increasing body of facts is beginning to challenge this orientation. It is becoming increasingly obvious that we must understand housing supply if we are to understand booms and busts in housing prices. Over the past five years (1998-2003), despite low inflation and the baby bust, real housing prices increased by 25 percent, according to the Freddie Mac Repeat Sales Index. During the 1975 to 1980 period, when inflation was soaring and baby boom children were moving out of their parents' homes, the same index showed real housing price increases of less than 20 percent.
Rising housing prices over the past ten years can always be explained by another omitted shifter of demand. However, evidence on construction suggests that demand alone cannot provide the answer. For example, in Manhattan, before 1975, housing price growth was modest, and there was abundant new construction. Since 1980, housing prices have soared and there have been few new units.(5) The physical character of Manhattan has not changed between 1960 and today. If the rise in housing prices during the 1990s were the result of demand pushing along a stable supply curve, then surely we would see an explosion in new construction as we did in the past. The increasingly common combination of rising prices and tiny amounts of construction pushes us to focus on housing supply.
Differences across regions confirm the need for supply-side analysis. High housing prices are not ubiquitous. The median housing value in the median county in America in the 2000 census is $75,300. More than 95 percent of countries have median housing values below $160,000. Soaring home prices are primarily coastal phenomena that have left the growing states of the American interior untouched.
If the heterogeneity in price growth with the United States were the result of different patterns of demand, then we would expect to see quantities and prices move together. Places with high price growth would be places with new construction. Figure 1 graphs the rate of housing price growth (again using to the Freddie Mac Repeat Sales Index) and permits for new housing units (divided by the stock of housing units in 1990) between 1998 and 2003 across census divisions. There is a negative 50 percent correlation between price growth and new construction.
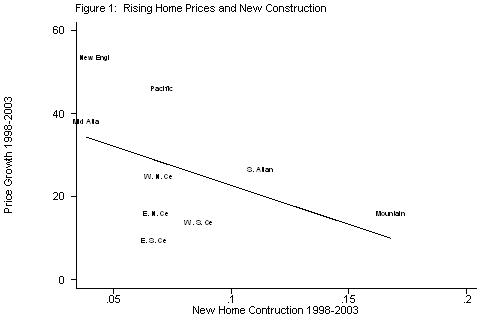
The places that are building have little housing price appreciation and the places that have housing price appreciation are not building. Demand alone can't explain the difference in housing price growth between New England and the South Atlantic. Florida alone permitted almost as many homes in 2002 as all of New England did over the entire five-year period. If we want to understand why housing is so expensive, then we must understand why housing supply in New England, the Middle Atlantic States, and California has become so inelastic. Housing supply research is also necessary because
regional growth rates depend on the rate at which these regions build homes.
Certain aspects of housing supply are straightforward. The construction market is competitive. According to the 2001 County Business Patterns, there are almost 215,000 establishments engaged in building, developing, and general contracting and 146,000 engaged in building single-family homes. Small contractors often thrive, so it is hard to imagine meaningful technological barriers to entry.
The physical costs of building homes are better understood than the costs of supplying most other commodities. Firms like R. S. Means have long surveyed contractors and provide extensive data on the average physical costs of building new units. While custom and high quality work costs more, many coastal professionals are surprised to learn that most single-family detached homes appear to cost around 80 dollars per square foot to build. In much of the country, $160,000 would be a reasonable price for a new 2,000 square foot home, so this shouldn't surprise us too much. Building taller buildings costs more and can reach as high as 250 dollars per square foot.(6) The time-series evidence suggests that these physical construction costs don't vary much over space, they don't vary much with short-term fluctuation in aggregate construction, and they have been declining secularly since the 1970s. Raw ingredients (for example, lumber) have been getting cheaper in real terms and firms have become more efficient.
Housing requires both land and structure, but there is an overwhelming quantity of cheap land in America. The Department of Agriculture assesses land values throughout the United States and the values of farmland range from about $200 per acre in New Mexico to $7,000 per acre in New Jersey. The U.S. average is $1,000 per acre, and even in California the average value of farmland is only $2,000 per acre. Even at $7,000 per acre, the cost of supplying a half-acre lot is quite small, both in absolute terms and relative to the physical costs of building.
These simple facts explain why housing remains and will remain inexpensive in most areas of the country. In the expanding cities of most of America, the automobile and other changes in transportation technologies have enabled firms and workers to decentralize and move factories and homes together into one-time farmland.(7) When employment was constrained to stay at the city center, housing with access to the center became expensive as the city grew. But in decentralized cities, there is no advantage to being in the center and as a result, rent gradients within the city disappear.(8)
Because the development of edge cities involves endless conversion of farmland into homes, the costs of construction remain tied to the physical costs of construction. Housing supply in the growing edge cities of the Sunbelt is almost perfectly elastic. It doesn't really matter whether the demand for housing in Las Vegas rises even more (it was America's fastest growing large city in the 1990s(9)) housing prices will remain low because prices remain tied to construction costs.
Of course, even where housing supply is perfectly elastic with respect to positive shocks, housing supply is inelastic with respect to sufficiently negative shocks. Because housing is fixed and durable, a major drop in housing demand can always cause prices to fall. This explains why cities decline so slowly and why declines show up in falling housing prices long before they show up in falling population levels.(10) Indeed, the growth in housing prices in New England has been so spectacular in part because 20 years ago New England was declining and housing cost less than the physical costs of replacing the buildings.
So, if America has so much land, and if the physical costs of construction don't increase much with the amount of new construction, why is so much housing so expensive? In Manhattan, the average price for condominiums has topped 600 dollars per square foot. In San Francisco suburbs like Marin or San Mateo counties, median housing values hover around $500,000. The physical costs of new construction do not explain these high prices. Something else must be making supply inelastic.
There are two primary hypotheses about why housing supply has become so inelastic in some areas. The first is that these places are high density and they are simply running out of land. This suggests that the heterogeneity in Figure 1 could be explained if we only controlled for the initial density in the area (it can't). The second hypothesis is that high housing prices are the result of land use regulation, which deters new construction, not the absence of land. This suggests that cross-space and cross-time variation in housing prices are best understood as the result of increasingly tough regulation of developers. This regulation of course may be a good thing. Developers do not naturally internalize every externality. Still, according to this hypothesis, regulation --not land shortage -- lies at the roots of high housing costs.
Joseph Gyourko and I have conducted a series of tests trying to distinguish between these two hypotheses. We looked at whether home prices are higher in metropolitan areas with less land per capita. This is not the case. Many of the most expensive California areas are actually quite low density. Conversely, measures of the regulatory environment (such as the time it takes to get a building permit) do correlate well with high housing costs across metropolitan areas.(11)
A second test of the land shortages hypothesis is whether a law of one price for land holds in a given area. In the absence of regulation, the price of a quarter acre of land should be the same whether it increases the lot size of one homeowner from .25 to .5 acres or if whether it provides the lot for a new home. In a free market, if the land was worth more sitting under a new home, then the half acre lot would be subdivided, but in a regulated market, a .25 acre lot (that include the right to have one house on that lot) may be worth almost as much as a .5 acre lot (that also includes that same right).
To test this hypothesis, we measure the value of land in two ways. We use traditional hedonic regressions that compare the value of supposedly otherwise identical homes with different size lots. These regressions estimate the value of extra land surrounding a house. We then measure the value of land by subtracting the construction costs of a home from its value and then treating the residual as the value of land. Other things, like site preparation, go into this residual, but we can estimate these costs by looking at the residuals across the country.
If high costs of housing are driven by land shortages and regulation is irrelevant, then these two different ways of estimating land prices should yield the same result, and in the less regulated, growing areas of the country, the estimates aren't far off. However, in the high cost areas -- California and the Northeast -- the hedonic price of land is about one-tenth of the value of land estimated by subtracting construction costs from housing values. As any developer knows, you could make a fortune buying homes in suburban Boston or San Francisco, subdividing the lots, and building new homes. These results support the regulation hypothesis.
In a recent paper(12), we turn to Manhattan. Manhattan certainly lacks land and historically, its high costs have come from the high cost of building up. However, without regulation, the cost of an apartment should not be much more than the cost of building up. Manhattan had many 15 and 20 story apartment buildings erected during the 1990s. In the absence of regulation, these buildings could have had 30 or 40 stories instead and if construction costs and apartment prices diverge, developers would want to build up. Without regulation, the price of an apartment in Manhattan should stay close to the marginal cost of supply, which is always the cost of building one more story. The fixed costs of an apartment building, including land, do not increase as you raise the building another story.
Using a variety of different sources, we measure the costs of building up. We look at the R.S. Means data and data from their competitors. We look at costs for high rise apartments outside of New York, which can't be below construction costs in those cities, and then try to adjust these costs to reflect higher labor and material costs in New York. We talked to developers. All in all, most estimates of the marginal cost of building up are below 200 dollars per square foot. Yet Manhattan apartments are selling for more than 600 dollars a square foot. There is no technological barrier to making Manhattan even taller. We are driven to believe that high housing costs in Manhattan are not the result of lack of land but rather the result of regulatory barriers to new construction. This conclusion is buttressed by the time-series evidence discussed earlier. Before 1980, despite high density levels, there was a lot of new building in Manhattan. During that era, apartment costs were close to the price of new constru ction. Since 1980, new construction has fallen and prices have soared.
Increasingly inelastic housing helps to explain high housing prices on the American coasts. This inelasticity is itself the result of an increasingly tough regulatory environment that deters new construction. The big question that remains is: what are the causes of these regulatory changes? Why is San Francisco so toughly regulated, but not Las Vegas? Why was Los Angeles a developer's dream in the 1960s, but not today? To understand the rise in housing prices, we must understand how local homeowners have become increasingly interested in blocking new construction and increasingly able to do so.
1. Glaeser is a Research Associate in the NBER's Programs on Economic Fluctuations and Growth, Law and Economics, and Aging. He is also a Professor of Economics at Harvard University.
2. L. H. Summers, "Inflation, The Stock Market and Owner-Occupied Housing," NBER Working Paper No. 606, August 1981.
3. J. M. Poterba, "Inflation, Income Taxes and Owner-Occupied Housing," NBER Working Paper No. 553, May 1985; and S. Rosen and R. H. Topel, "A Time-Series Model of Housing Investment in the U.S.," NBER Working Paper No. 1818, January 1986.
4. N. G. Mankiw and D. N. Weil, "The Baby Boom, The Baby Bust and the Housing Market" NBER Working Paper No. 2794, March 1990.
5. E. L. Glaeser, J. Gyourko, and R. Saks, "Why is Manhattan So Expensive? Regulation and the Rise in House Prices," NBER Working Paper No. 10124, November 2003.
6. See E. L. Glaeser, J. Gyourko, and R. Saks, "Why is Manhattan So Expensive? Regulation and the Rise in House Prices."
7. E. L. Glaeser and M. E. Kahn, "Sprawl and Urban Growth," NBER Working Paper No. 9733, May 2003.
8. E. L. Glaeser and M. E. Kahn, "Decentralized Employment and the Transformation of the American City," NBER Working Paper No. 8117, February 2001.
9. E. L. Glaeser and J. Shapiro, "Is There a New Urbanism? The Growth of U.S. Cities in the 1990s" NBER Working Paper No. 8357, July 2001.
10. E. L. Glaeser and J. Gyourko, "Urban Decline and Durable Housing," NBER Working Paper No. 8598, November 2001.
11. E. L. Glaeser and J. Gyourko, "The Impact of Zoning on Housing Affordability" NBER Working Paper No. 8835, March 2002.
12. See E. L. Glaeser, J. Gyourko, and R. Saks, "Why is Manhattan So Expensive? Regulation and the Rise in House Prices."