NBER Reporter 2014 Number 1: Research Summary
Bank Leverage and Credit Supply
Hyun Song Shin *
Banks and other types of financial intermediaries are of special interest given their role in the economy and as their balance sheet decisions have direct implications for credit supply. In spite of this, financial firms are routinely excluded from the data samples in empirical studies in corporate finance. This means that some of the features of financial firms that make them special are often not addressed. Peering into the corporate finance of banks reveals some important lessons.
Basics of the Corporate Finance of Banking
Consider something as basic as leverage. Define leverage as the ratio of total assets to the equity of a firm. Figure 1 shows three ways that a firm (financial or otherwise) can increase its leverage. In each case, the gray shaded area represents the balance sheet component that does not change.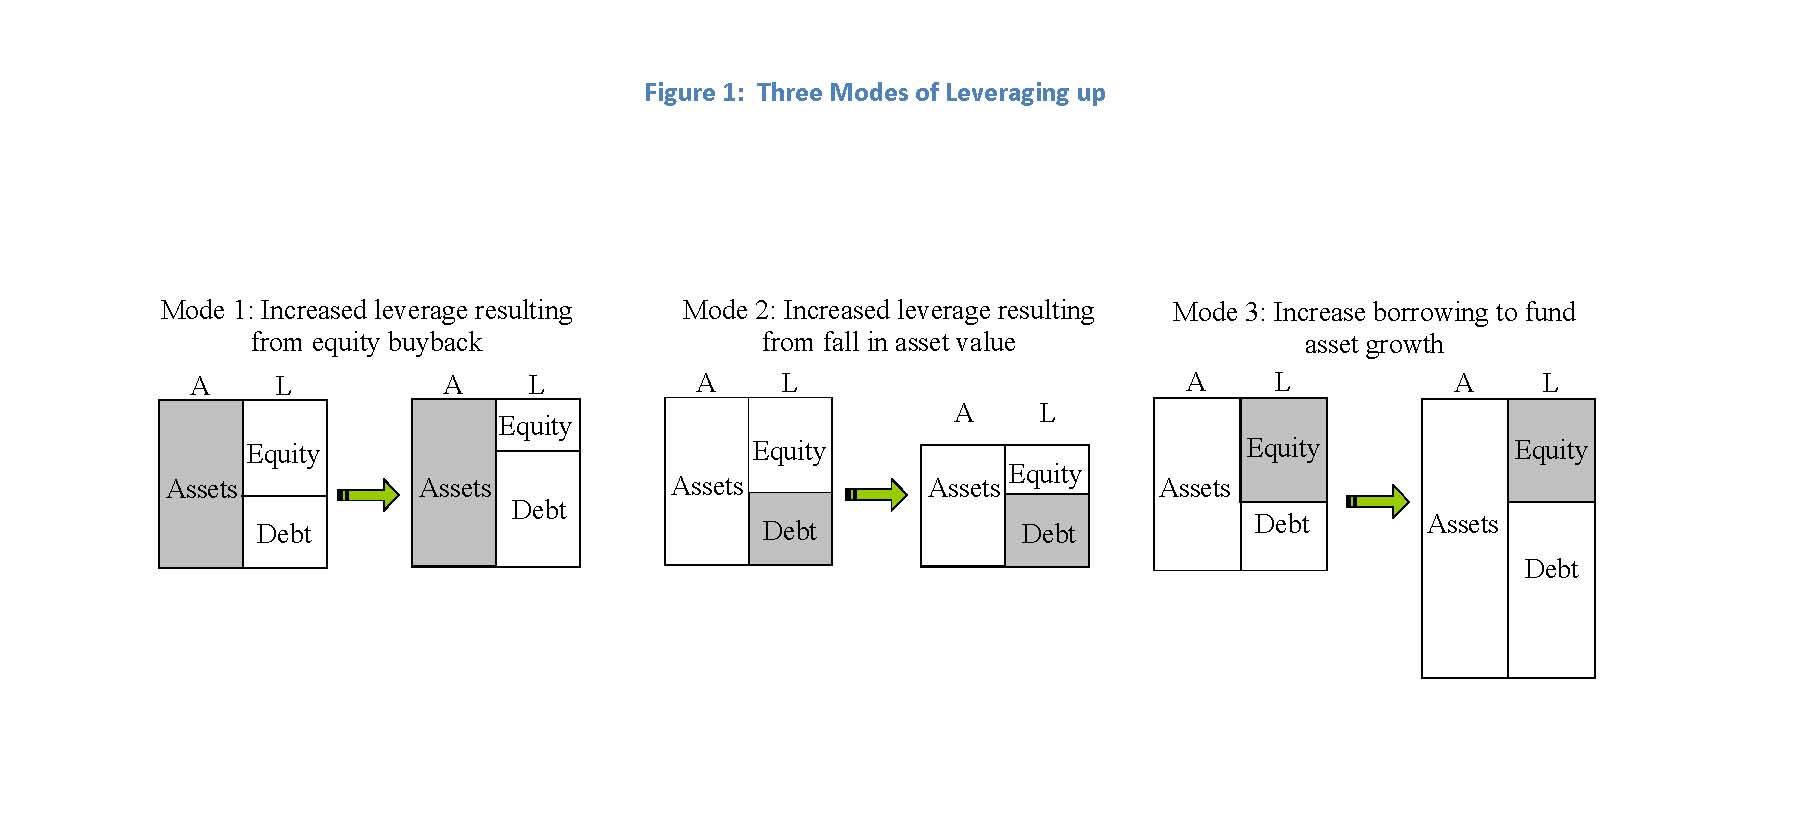
(pdf)
Mode 1 on the left is the case typically dealt with in MBA textbooks in corporate finance. It depicts a financial operation where the firm issues debt and buys back equity with the proceeds of the debt issue. The assets of the firm are unchanged. This is the way, for instance, that a private equity fund would acquire a target firm. Mode 2 depicts the consequences of a dividend paid to shareholders financed by an asset sale. The leverage goes up because the debt remains in place, but the assets shrink in value. The shrinking of the asset value could reflect - simply a decline in the price of the assets, so that the increase in leverage is the result of market value changes.
However, for banks neither Mode 1 nor Mode 2 turns out to be the right picture. Banks adjust their leverage as in Mode 3, where new assets are financed by issuing new debt, with equity varying very little.
(pdf)
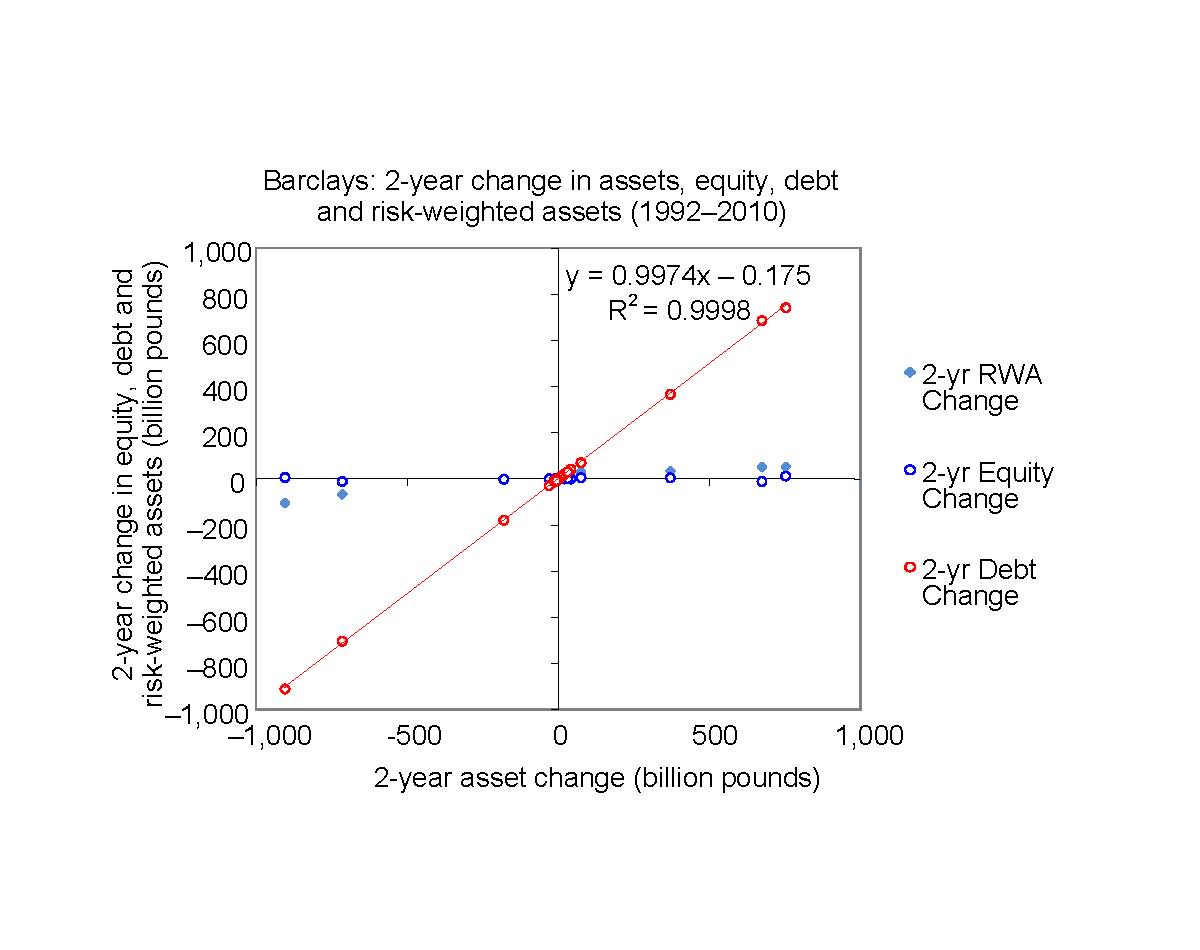
Figure 2: Two year changes in assets, equity, debt and risk‐weighted assets of Barclays (Source: Bankscope)
Figure 2 shows the scatter plot of the change in total assets, debt, and equity of Barclays. Each point corresponds to a change in one of these measures over a two-year period during the 18-year period of 1992 to 2010. There are nine such intervals. The data show very small changes in equity, even when assets change substantially during a two-year period. However, for debt the fitted line through the scatter plot between the change in assets and the change in debt has a slope very close to one, meaning that the change in assets is almost all accounted for by the change in debt, just as in Mode 3 above. Since the total assets of the bank and the leverage of the bank move in lockstep in Mode 3, a theory of bank leverage gives a theory of bank credit supply.
Book Value of Assets and Bank Lending
The equity series in the scatter chart shows changes in the book value of equity, not the market capitalization of the bank. In empirical corporate finance studies for non-financial firms, it is customary to give more weight to the market capitalization than to the book equity. The rationale is that the accounting values do not reflect the true market value of the firm and for questions related to how much the firm is worth, it is better to examine the enterprise value of the firm, where enterprise value is defined as the sum of the equity market capitalization and the value of debt.
However, for banks the book value of assets conveys information on how much the bank lends. The book value of assets grows when the bank extends more loans. So, if our focus is on credit supply, then the book value of assets is a meaningful quantity. To be sure, researchers are also interested in how much the bank is worth to claim holders, a question for which the bank's enterprise value would be informative. But we are also interested in how much the bank lends, especially for macro applications. For this, we need to look at book values.
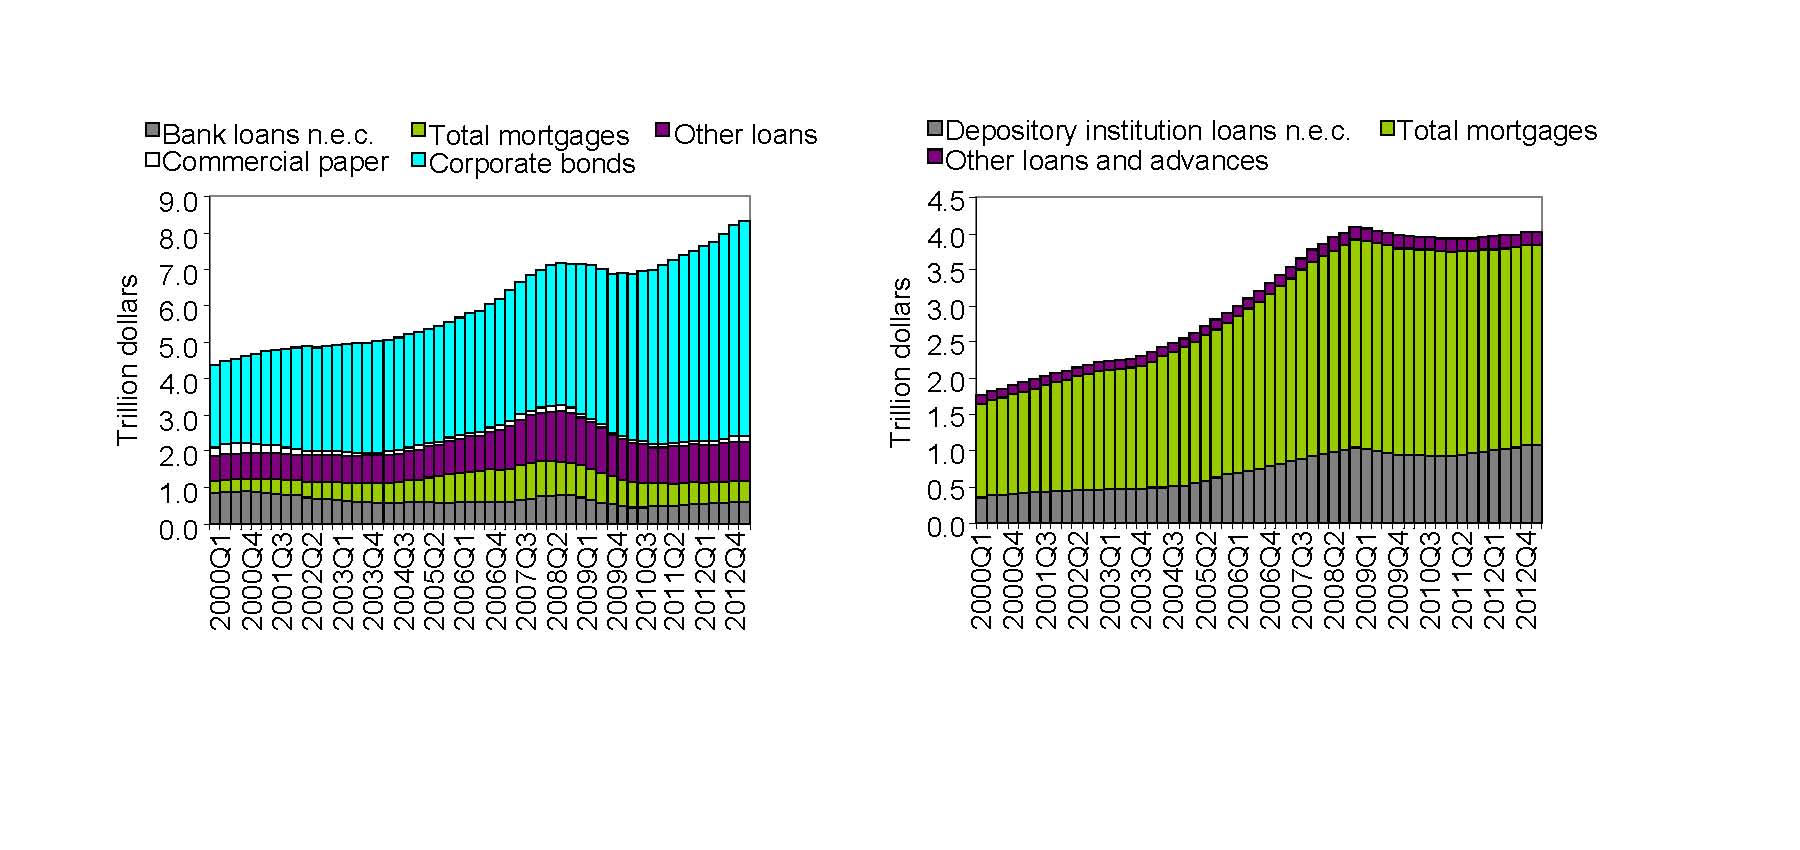
In joint research with Tobias Adrian and Paolo Colla,1 I explore bank credit supply and how it differs from the credit that firms obtain through the bond market. Figure 3 shows total credit to U.S. non-financial businesses classified into whether the borrower is a corporate business or a non-corporate business. The left panel shows total credit to the corporate business sector and the right panel shows total credit to the non-corporate business sector.
(pdf)
Figure 3: Credit to US non-financial corporate business sector (left) and non-financial non-corporate business sector (right)
(Source: Federal Reserve Flow
of Funds, Tables L102, L103)
We note that lending to corporate businesses has surged - since the financial crisis, mainly as a result of rising bond financing. Total credit to corporate businesses is much higher than before the crisis thanks to the increase in bond financing. In contrast, lending to non-corporate businesses has remained stagnant. Since small firms do not have the capacity to tap the bond market, they - rely exclusively on bank lending. Bank lending rates have also remained high since the crisis. The left panel of Figure 4 shows the bank lending rate to U.S. businesses from a Fed survey, when the risk is "moderate" and the maturity is - longer than one year. The lending rate has remained high, long after the Fed funds rate went to zero. The right panel of Figure 4 shows the spread between the bank lending rate and the Fed funds rate, which has stayed high at around 4 percent.

(pdf) Figure 4: Weighted-Average Effective Loan Rate for More than 365 Days, Moderate Risk, All Commercial Banks (EELMNQ), the effective Fed Funds rate and the spread between the two.
(Source: Federal Reserve survey of business lending conditions)
Procyclicality of Bank Lending
The availability of credit and how credit varies over the business cycle are clearly matters of great importance. Some cyclical variation in total lending is to be expected even in a frictionless world as there would be more positive net present value (NPV) projects that need funding when the economy is strong than when it is weak. The question is whether the fluctuations in lending are larger than would be justified by changes in the incidence of positive NPV projects. The fact that bank lending behaves so differently from bond financing suggests that credit supply by banks needs additional explanation.
Adrian and I2 delve deeper into the reasons for the procyclicality of leverage and document the important explanatory role played by measured risks through the banks' value at risk (VaR). Formally, VaR is a quantile measure on the loss distribution, defined as the smallest threshold loss L on the bank's loan book, such that the probability that the realized loss turns out to be larger than L is below some fixed probability α. Roughly speaking, - VaR is a measure of the "approximate worst case loss" for the bank in the sense that anything worse than this worst case loss happens only with some small probability α.
Adrian and I find that the - VaR per dollar of assets fluctuates widely over the financial cycle in step with measures of risk such as the implied volatility embedded in the price of equity options. However, there are much more modest fluctuations in the banks' VaR per dollar of equity. In fact, the rule of thumb that banks keep the ratio of VaR to equity constant is a useful benchmark.
The reason why the VaR-to-assets ratio fluctuates widely, but the VaR-to-equity ratio does not, is accounted for by the active management of leverage by intermediaries, especially the active shedding of risks through deleveraging during times of market stress. In other words, banks cut back lending when measures of risk go up so that their total VaR is kept roughly constant. This suggests that financial intermediaries such as banks are shedding risks and withdrawing credit precisely when the financial system is under the most stress, thereby amplifying the downturn.
Some telltale signs of such behavior can be seen in our scatter chart for Barclays, Figure 2, which shows the relationship between changes in total assets and changes in risk-weighted assets. Risk-weighted assets are obtained by multiplying the bank's holdings of each type of asset by the measured risks associated with the asset. When balance sheets are expanding rapidly, risk-weighted assets show only modest increases, reflecting the lowering of risk weights during booms. In contrast, during downturns when the bank is contracting lending there is only a marginal reduction in risk-weighted assets - because of the increase in the measured risks associated with lending.
Adrian and I explore a principal-agent model of the bank that could account for such procyclical behavior if the creditors to the bank impose tighter funding constraints on the bank, akin to the higher "haircuts" that are imposed on borrowers in repurchase ("repo") agreements during downturns. In a benchmark case that we consider, in which uncertainty is described by the extreme value distribution (EVT), the optimal contract between the creditors and the bank includes a leverage limit on the bank that implies a fixed probability of bank failure, irrespective of the risk environment. Since measured risk fluctuates over the cycle, imposing a constant probability of failure implies very substantial expansions and contractions of the balance sheet of the bank for any given level of bank equity. In other words, the contract implies substantial leveraging and deleveraging over the cycle.
International Dimension
The procyclicality of bank lending also has an international dimension. Valentina Bruno and I3 address the global factor in cross-border bank capital flows and explore how global "push" factors that are associated with the bank leverage cycle act as global factors that drive cross-border capital flows across the world. Policy discussion has revolved around the notion of "global liquidity" whereby permissive credit conditions in financial centers are transmitted across borders to other parts of the world, leading to highly synchronized fluctuations in capital flows and financial conditions across jurisdictions. 4
Bruno and I explore a model of global liquidity built around the operation of international banks in a "double-decker" model of banking where local banks borrow in U.S. dollars from global banks in order to lend to local corporate borrowers. In turn, the global banks finance cross-border lending to regional banks by tapping U.S. dollar money market funds in financial centers. One distinctive feature of our approach is that it generates a link between currency appreciation and the buildup of leverage in the banking sector. The link arises from shifts in the effective credit risk faced by banks who lend to local borrowers that may have a currency mismatch. When the local currency appreciates, local borrowers' balance sheets become stronger, resulting in lower credit risk and hence expanded bank lending capacity. In this way, currency appreciation leads to greater risk-taking by banks. This "risk-taking channel" of currency appreciation entails a link between exchange rates and financial stability. The rapid growth of the banking sector fueled by capital inflows and an appreciating currency has been a classic early warning indicator of emerging economy crises. 5 The framework in Bruno and Shin (2013) addresses the theoretical mechanism that links currency appreciation and the buildup of leverage, in contrast to conventional macro models of exchange rates where the focus is on the current account.
Summary
Empirical studies in corporate finance routinely exclude banks from the analysis - because of their special nature. Given banks' importance as suppliers of credit to the economy, a focused study of the corporate finance of banking has value in its own right. Banks manage their balance sheets in a procyclical manner, expanding lending during boom times when measured risks are low and restricting lending during the downturn when measured risks increase. In a general equilibrium context, such procyclical behavior could be expected to have feedback effects that amplify shocks.
* Shin is a Research Associate in the NBER's Program on Corporate Finance. He is the Hughes-Rogers Professor of Economics at Princeton University.
1. T. Adrian, P. Colla, and H. S. Shin, "Which Financial Frictions? Parsing the Evidence from the Financial Crisis of 2007-9," NBER Working Paper No. 18335, August 2012, and NBER Macroeconomics Annual 2012, Volume 27, D. Acemoglu, J. Parker, and M. Woodford, eds., Chicago, IL: University of Chicago Press, (2013), pp. 159-214.
2. T. Adrian and H. S. Shin, "Procyclical Leverage and Value-at-Risk," NBER Working Paper No. 18943, April 2013, and Review of Financial Studies 27 (2014), pp. 373-403.
3. V. Bruno and H. S. Shin, "Capital Flows, Cross-Border Banking and Global Liquidity," NBER Working Paper No. 19038, May 2013.
4. T See Bank for International Settlements, "Global Liquidity - Concept, Measurement and Policy Implications," Basel, 2011, http://www.bis.org/publ/cgfs45.pdf , and H. Rey, "Dilemma not Trilemma: The Global Financial Cycle and Monetary Policy Independence," forthcoming in the Proceedings of the Federal Reserve Bank of Kansas City Economic Symposium at Jackson Hole, 2014.
"Stories of the Twentieth Century for the Twenty-First," NBER Working Paper No. 17252, July 2011, and American Economic Journal: Macroeconomics, 4 (2012), pp. 226-65; and M. Schularick and A. Taylor, "Credit Booms Gone Bust: Monetary Policy, Leverage Cycles, and Financial Crises, 1870‒2008," NBER Working Paper No. 15512, November 2009, and American Economic Review 102 (2012), pp. 1029-61.