NBER Reporter 2013 Number 2: Research Summary
What Determines International Wages and Prices?
Mario Crucini *
Introduction
Wages and salaries are by far the predominant source of purchasing power for all but the wealthiest individuals in society. The real wage -- that is, the ratio of one's nominal wage to the unit cost of a basket of goods and services one chooses to consume -- is thus strongly positively associated with the health and welfare of individuals and their families. When goods and labor markets are perfectly competitive, and devoid of barriers to trade or factor mobility, identical goods or workers should command the same market price no matter where the good is sold or the worker is employed. That absence of barriers to trade and factor mobility ensures that arbitrage in goods and labor markets maintains equality of prices and wages.
As it turns out, even within countries, identical workers are not necessarily paid the same nominal wage, nor do they face common market prices of goods and services and consume identical consumption baskets. Therefore, considerable research has been devoted to measuring wage and prices differences and exploring the broader economic implications of those differences.
My collaborative empirical and theoretical research focuses on retail prices of individual goods and services in local currency units (as opposed to index numbers that comprise the sub-indexes of the CPI) and on the use of cities as the spatial unit of account (as opposed to national averages). The cross-sectional differences in price deviations by good and location allow us to identify more of the underlying microeconomic structure of commodity and labor markets and to sustain a richer and more empirically robust class of economic theories.
Long-run Wage and Price Dispersion, the "Penn-Effect"
My early work with Christopher Telmer and Marios Zachariadis studies retail prices of thousands of goods and services across European capital cities at five-year intervals between 1975 and 1990.1 The underlying data for international price comparisons for this period come from Eurostat, the statistical agency of the European Union, which coordinated the price survey and asked each National Statistical Agency (NSA) to match the exact brand, make, and model of each item across cities. The Eurostat approach was intended to depart from the method used by NSAs to construct domestic CPI indexes, whereby market prices are weighted to reflect domestic consumption patterns. The CPI methodology violates the premise of identical baskets needed to assess the purchasing power parity hypothesis that is, equality of the cost of a common and broad basket of retail goods and services across countries. The Eurostat methodology satisfies the research criteria.
Average price difference across goods, relative to the EU mean price, ranged from a high of 21.9 percent for Denmark to a low of -25.4 percent for Portugal in 1990. In other words, if Danes shopped in Portugal, they would save 47.3 percent of their expenditure relative to shopping at home. Conversely, if these price differences reflect arbitrage costs in goods markets, then the costs would need to be enormous relative to shipping costs.
After adjusting for differences in the Value Added Tax (VAT), the gap drops to 39.5 percent. We attribute part of the large remaining price level difference across Denmark and Portugal to the fact that they are at opposite ends of the EU income distribution, Denmark with the second highest per capita income after Luxembourg, and Portugal with the lowest (the theoretical rationale for this correlation is elaborated below).
We also indirectly examine the role of trade costs using an index of tradability, finding that goods and services that enter to a greater extent into EU trade volumes relative to production volumes tend to have lower geographic price dispersion. For example, going from the least traded sector (such as a haircut) to the most traded sector (unleaded gasoline), EU price dispersion drops from 43 percent to 12 percent.
The strong positive correlation between income levels and price levels is known as the "Penn Effect" in acknowledgement of the seminal work of Irving Kravis, Alan Heston, and Robert Summers who initiated the International Comparison of Prices Program (ICP) in the 1960s at the University of Pennsylvania and first documented the correlation.
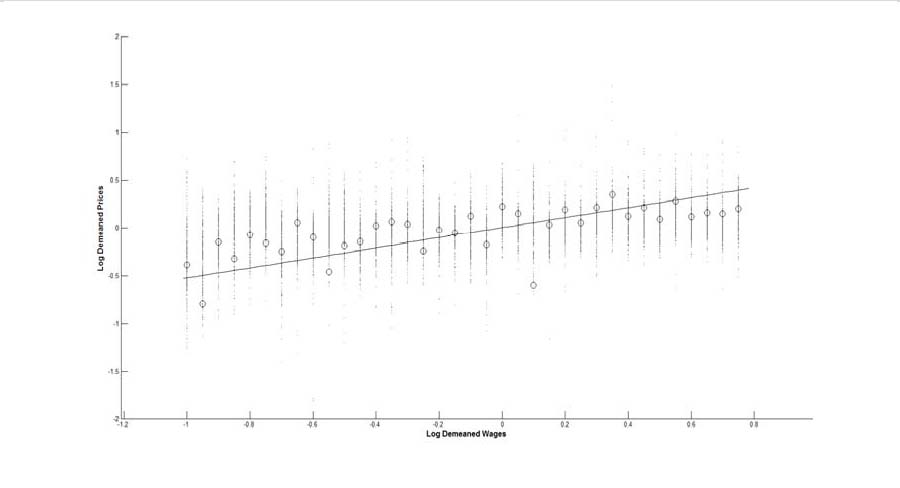
Hakan Yilmazkuday and I conducted the first systematic investigation of the "Penn Effect," integrated across microeconomic and macroeconomic levels. 2 Figure 1 presents a scatterplot of prices of many individual goods and services versus a single wage rate (hourly wage paid to domestic help) in more than 100 capital cities of the world. Each dot represents the price of a single retail good and hourly wage for domestic help in a particular city. All the prices and wages are expressed in percentage deviations from their world-wide averages and then averaged over the years 1990 to 2005 to focus on the long-run differences associated with the Penn Effect. The vertical lines reflect that fact that one city wage measure is paired with the entire price distribution of that same city. The open circle is the consumption expenditure weighted average price deviation for that city. These data come from the Economist Intelligence Unit Worldwide Cost of Living Survey, which includes the familiar Big Mac prices and approximately 300 other retail prices.
 (pdf)
(pdf)
The slope of the estimated line through the scatter is 0.54, which means a doubling of the nominal wage is associated with only about a 50 percent increase in the price of the basket of goods. Alternatively, a doubling of the nominal wage is associated with a 50 percent increase in the real wage, or real purchasing power. Why is this?
In an earlier joint paper, we developed a model of trade across cities with each city possessing a manufacturing and retail sector. We show that the slope coefficient in this regression identifies the average (across goods in the price survey) cost share of local (retail) inputs in the production of final consumer goods and services. 3 The economic logic of this is straightforward and more general than the specific model we articulate.
The same argument helps us to understand the heterogeneity across goods, once it is recognized that retail items have different cost shares of local and traded inputs. For example, we would expect haircuts and wages of domestic help to be perfectly correlated, a slope of one in the Figure, because arbitrage across these two low skilled occupations keeps the relative wage across them equalized in each location, and there are no traded inputs of consequence in the provision of haircuts. At the opposite extreme, if the item is purely traded, involving no local inputs, then the correlation of the price with local wages should be zero. That is, while barriers to trade would generate price deviations across locations, these are not expected to be correlated with wages across these locations. In practice there are no retail items satisfying the strict definition, involving no cost from the manufacturer to the final consumer beyond a shipping cost. Gasoline sold at the retail level comes closest: it has a cost share of local inputs of about 0.19 based on U.S. National Income and Product Accounts data, giving rise to a modest positive slope for this highly traded commodity.
According to our model, what is not explained by differences in local input costs across cities can be attributed to trade costs, estimated as a function of distance and a border-effect, as in the paper by Charles Engel and John Rogers. 4 For the typical retail item, trade costs contribute to distribution costs comparably to international price deviations, while varying in relative importance as we move from gasoline to haircuts as described earlier. In contrast, after aggregation to the price level, local costs account for the lion's share of international price dispersion, because trade costs largely average out across goods.
This evidence suggests that in the long-run, the efficiency gains brought about by international trade in goods are broadly shared and reduce the cost of traded inputs globally. In contrast, the difference in the distribution and retailing costs of those goods is largely born by consumers in the location of the final sale.
Stepping a bit beyond the existing analysis, the fact that the share of services in consumption is growing relative to goods suggests that markets actually may be becoming more segmented over time despite significant reductions in official and natural barriers to trade in goods. This makes the study of the prices and efficiencies of services -- including education, medicine, infrastructure, and distribution services -- even more compelling going forward.
Time- Series Variation in Relative Wages and Prices
The long-run deviations depicted in Figure 1 are only part of the story. The time-series variation around these long-run averages is economically significant and remains poorly understood. To appreciate this, it is instructive to engage in a thought experiment and some casual empiricism. Since the collapse of the Bretton Woods system of fixed nominal exchange rates, most national currencies are traded in centralized financial markets. The relative value of currencies or nominal exchange rates varies continuously over time. The magnitudes of the daily changes are not trivial; changes of a single percentage point in a single day are not uncommon. Also, retail prices typically remain fixed for days, weeks, or even months, depending on the item. Because the nominal exchange rate is used to convert domestic and foreign prices into comparable units, it must be true that changes in the nominal exchange rate translate into changes in real exchange rates, the relative prices of goods and services when expressed in common currency. The same is true of relative wages. The implications of these changes in international relative prices and relative wages often depend on their duration or, put differently, how persistent the deviations are.
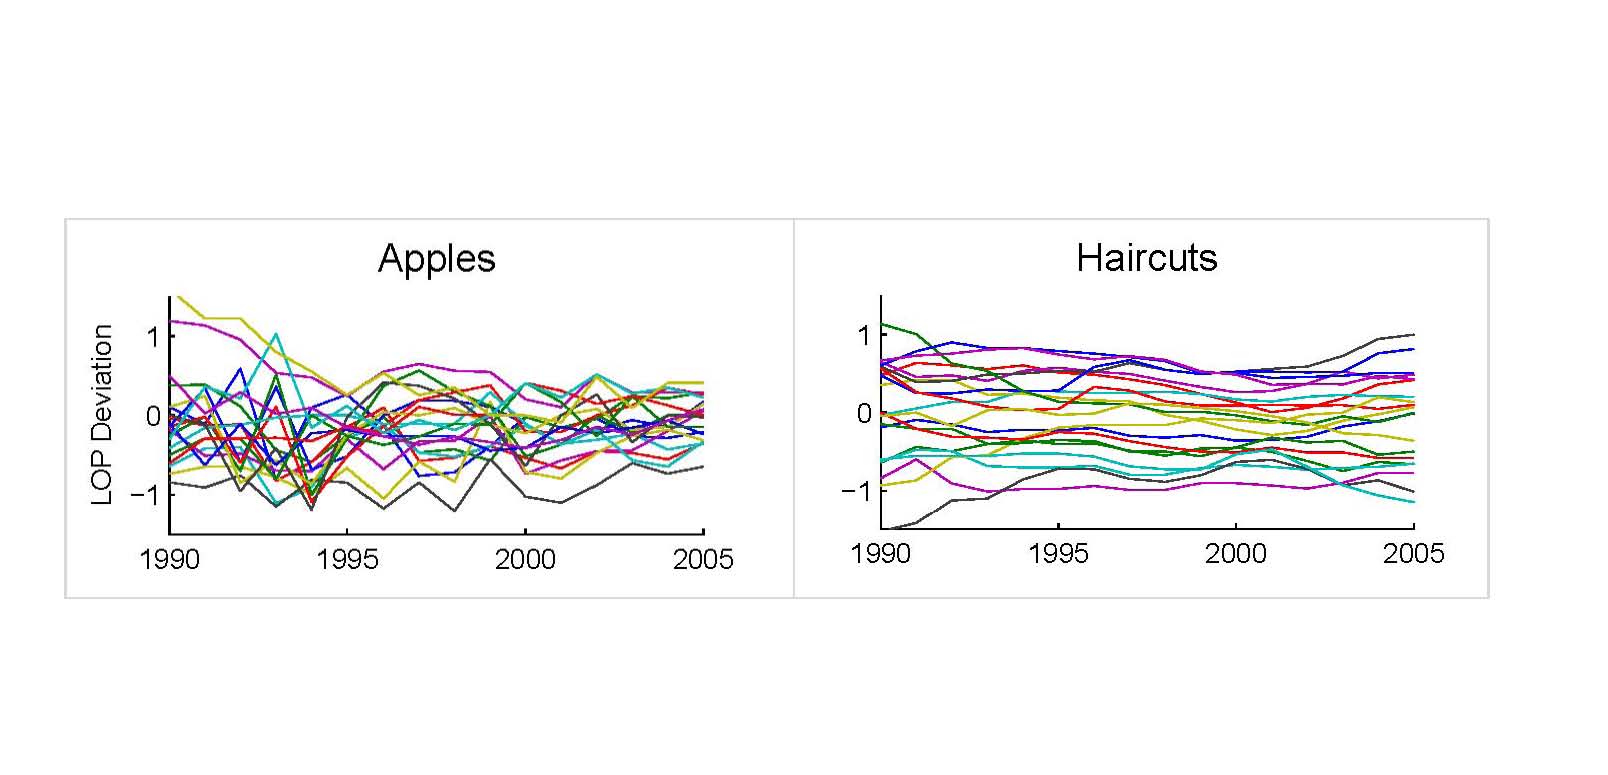
While it is true that few, if any, international retail prices respond immediately to developments in foreign exchange markets, it is instructive to examine how international relative prices fluctuate over time. For example, we can contrast a highly traded good, such as an apple, with a non-traded service, such as a haircut (Figure 2). The lines depicted in these charts are price of apples and haircuts in common currency units relative to the mean across locations. The figures focus on U.S.-Canada city pairs from the EIU data.
 (pdf)
(pdf)
Obviously, the Law of One Price (LOP) fails in both of these markets. There are price deviations across these markets at each point in time and on average over time (that is, in the long run). The deviations of apple prices across the cities of North America appear both more volatile and less persistent than the haircut prices. That is, when haircut prices are found to be high in one city relative to another in a particular year, one should expect this to be true on average over time. In contrast, the lines in the apple figure cross each other and the zero line indicating changes in the ranking of markets in terms of relative apple prices. In this sense, the relative price of apples is less predictable than that of haircuts, and one way to summarize predictability is by measuring persistence over time (does a high relative price today lead one to expect a high relative price in the future?). The higher persistence of price deviations in the case of haircuts relative to apples is consistent with the greater arbitrage costs in the case of haircuts than apples.
Mototsugu Shintani and I estimate good-specific persistence of LOP deviations for more than 250 goods and services (including apples and haircuts) across hundreds of international city pairs, including city pairs within the same country. 6 For OECD city pairs, the median half-life of LOP deviations is 19 months, well below the Purchasing Price Parity (PPP) consensus range of three to five years in studies using aggregate CPI data. Dividing the sample into goods and services, the median half-life is 24 months for services and 18 months for goods. These findings are broadly consistent with the contrast provided by apples and haircuts in Figure 2.
Starting in the 1960s, international macroeconomists adopted a two-sector trade model with one sector featuring non-traded services and the other traded goods. The prices of goods were treated as satisfying the LOP; PPP deviations were assumed to arise only from non-traded services. These assumptions were based more on intuition than hard measurement of relative prices and they collapsed under scrutiny by Charles Engel when he claimed to have shown that non-traded goods accounted for none of the variability in relative price levels.7 Subsequent to this finding, virtually all macroeconomic models of nominal price level adjustment embody the assumption that all goods adjust to nominal exchange rates with a lag and at the same rate. In other words, when the dollar depreciates relative to the Euro by 10 percent over the course of a month, all goods are assumed to become more expensive in the United States relative to Europe, whether they are traded or not.
In joint work with Anthony Landry, I revisit Engel's variance decomposition using microeconomic data and show the similarity of real exchange rate behavior across traded and non-traded sub-indexes of the CPI is more a reflection of the inadequacies of the CPI data for the purpose at hand than deficiencies of the underlying economic theory.8 Just as my work with Yilmazkuday finds long-run international price dispersion is rising in the cost share of non-traded inputs, my work with Landry finds that the contribution of local costs to the time-series variability of international relative prices is rising in this same cost share. Continuing with our earlier example, in moving from gasoline to haircuts, the contribution of local inputs (significantly, relative wage costs in retail) to time-series variability of the relative price of the final good increases from 30 percent to 91 percent. As Engel acknowledges, the CPI sub-indexes are poorly suited to identifying these differences. For example, the so-called traded category, food, includes both groceries and restaurant meals. According to U.S. NIPA data, the cost share of local inputs is about 0.30 for groceries and 0.75 for restaurant meals. Averaging the two sub-indexes to construct a food price sub-index completely obscures this difference. Not surprisingly, what results is a relative price that is driven roughly equally by local and traded input relative prices.
Having established heterogeneity in the variance of relative prices in the cross-section, I explore the structural sources of variability with coauthors Mototsugu Shintani and Takayuki Tsuruga.9 In particular, we weigh in on a long-standing debate originating with Michael Mussa who emphasized the role of sticky prices and nominal shocks in accounting for real exchange rate variability and Alan Stockman who emphasized flexible prices and real shocks. Using a Calvo time-dependent pricing framework to encompass the two approaches, we demonstrate that the variance of real exchange rates is increasing in the frequency of price changes in the presence of real shocks and decreasing in the frequency of price changes in the presence of nominal shocks, exactly as Mussa and Stockman had argued. Given the observed frequency of price changes in the microeconomic data, our theoretical model predicts a real exchange rate volatility curve. The empirical shape the curve takes in practice depends on the relative importance of real and nominal shocks across goods.
Consider our two stark empirical examples to elucidate the thrust of the debate. Gasoline prices are not nominally rigid. For this reason, nominal exchange rate changes pass through quickly to the retail prices of gasoline. The same is true of the response of gasoline prices to changes in world demand and supply of oil. However, the composition of energy differs across locations, even within countries, so the real exchange rate for utilities will be volatile and persistent as the relative prices of different fuels changes. For example, as the United States increases its production of natural gas relative to crude petroleum, the relative price of utilities across regions changes, based on differences in regional energy composition (the Northeast relies more on heating oil and the West relies more on natural gas, for example). Now consider a haircut: haircut prices typically are posted on menus that change infrequently. Consequently, the relative price of haircuts across locations within a country is very stable in local currency. This implies that in the presence of floating nominal exchange rates, the international relative price of haircuts will move closely with the nominal exchange rate and thus be dominated by nominal shocks.
Exploiting a cross-section of 66 sectors across the United States and Austria, Belgium, France, and Spain, we estimate what we call the "exchange rate volatility curve," which relates the conditional variance of real exchange rates to the infrequency of observed price changes, sector-by-sector. The curve is mostly downward sloping reflecting the dominance of real shocks in accounting for the variance of the international relative prices of most goods. At the one-month horizon, the role of nominal shocks is 40.6 percent when all goods and country pairs are pooled. However, the value drops to less than 15 percent at a horizon of one year.
How integrated are international markets? The answer depends on the market in question, the locations under examination, and the historical period. There are also some important interactions, such as the fact that retail goods by their very nature are combinations of traded goods and local services. Market integration ranges from largely complete in the case of primary commodities, such as oil, to barely begun, as in the cases of education and medical care. My research points to the necessity of microeconomic price data at the level of cities to address both microeconomic and macroeconomic facets of wage and price determination. The Center for International Price Research has a large and growing number of archives of international price data, posted along with references to papers that use them.10
* Crucini is a Research Associate in the NBER's Program on International Finance and Macroeconomics and a Professor of Economics at Vanderbilt University.
1. M. J. Crucini, C. I. Telmer, and M. Zachariadis, "Understanding European Real Exchange Rates," American Economic Review, Vol. 95(3) (June 2005), pp. 724-38.
2. M. J. Crucini and H. Yilmazkuday, "Understanding Long-run Price Dispersion," NBER Working Paper No. 18811, February 2013.
3. M. J. Crucini and H. Yilmazkuday, "A Model of International Cities: Implications for Real Exchange Rates," NBER Working Paper No. 14834, April 2009.
4. C. Engel and J. Rogers, "How Wide Is the Border?" The American Economic Review, 86(5) (1996) pp. 1112-25.
5. M. J. Crucini and C. Telmer, "Microeconomic Sources of Real Exchange Rate Variability," NBER Working Paper No. 17978, April 2012.
6. M. J. Crucini and M. Shintani, "Persistence in Law-of-One-Price Deviations: Evidence from Micro-Data," Journal of Monetary Economics, 55:3 (April 2008), pp. 629-44.
7. C. Engel, "Accounting for U.S. Real Exchange Rates," Journal of Political Economy, 107(3), pp. 507-38.
8. M. J. Crucini and A. Landry, "Accounting for Real Exchange Rates Using Micro-data," NBER Working Paper No. 17812, February 2012.
9. M. J. Crucini, M. Shintani, and T. Tsuruga, "Do Sticky Prices Increase Real Exchange Rate Volatility at the Sector Level?" NBER Working Paper No. 16081, June 2010, and forthcoming in the European Economic Review.
10. The main web page for the Center for International Price Research is: http://www.vanderbilt.edu/econ/cipr/ menus direct the visitor to data archives, papers and conference announcements.