NBER Reporter 2012 Number 4: Research Summary
Cross-Border Capital Flows, Fluctuations and Growth
Sebnem Kalemli-Ozcan *
What is the extent of international financial integration, and how does such integration affect economic fluctuations and growth? Does the effect differ during tranquil times versus times of financial crisis? Does financial integration transmit shocks across the globe and lead to contagion? In recent research, together with my co-authors, I search for answers to these and other related questions using both macro-level country data and micro-level firm data.
Capital Flows: Where and Why?
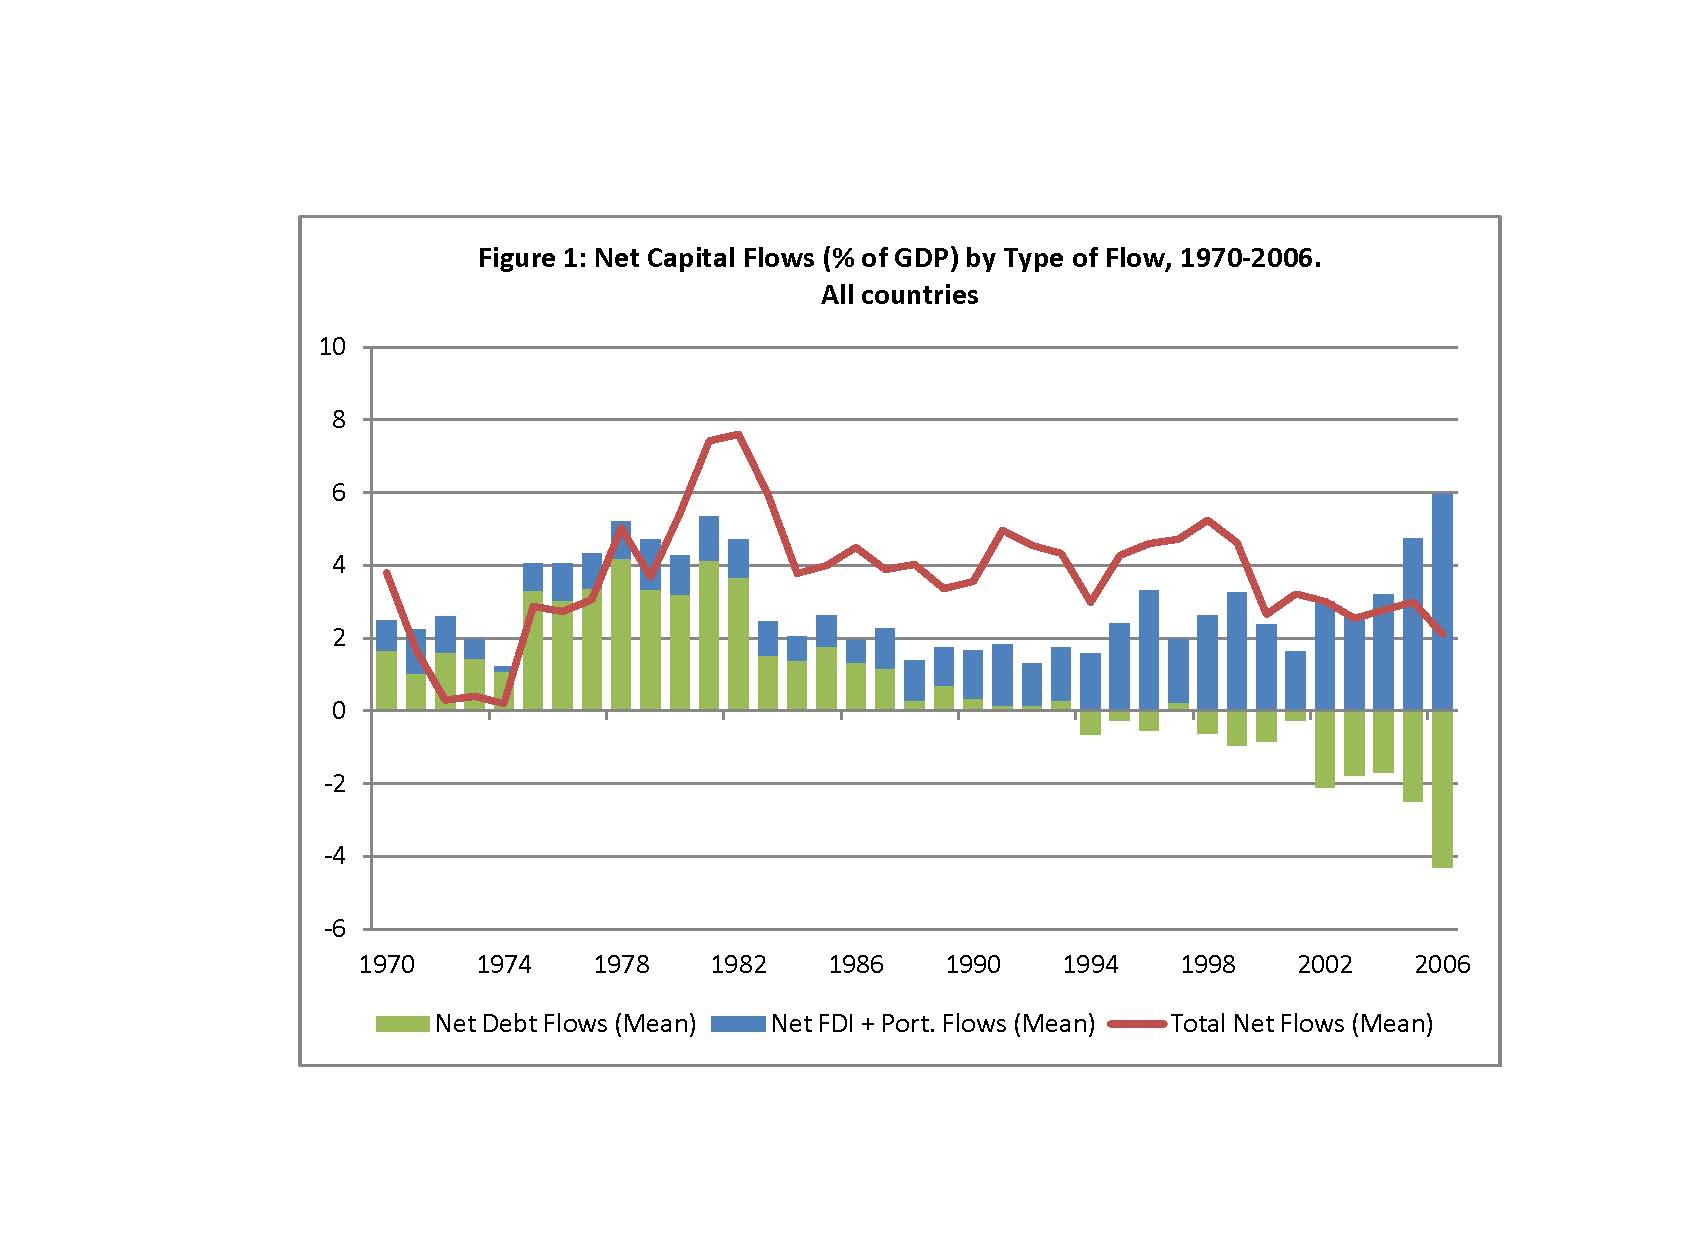
One common definition of international financial integration is the amount of cross-border capital flows. These flows can take the form of foreign direct, portfolio equity, and debt investment, constituting the financial account---the mirror image of current account in the balance-of-payments statistics. Figure 1 plots the average current account balance with reverse sign as a measure of total net capital flows from more than 150 countries, together with different types of flows.1
 (pdf)
(pdf)
The red line shows that the world is running a current account deficit, roughly around 4 percent of GDP, implying positive net capital flows on average since the 1970s.2 Since the 1990s, however, countries seem to be net borrowers in FDI and equity investment and net lenders in debt instruments.3 This simple plot hints that current account may not be informative in terms of testing the predictions of certain classes of models for the amount and direction of capital flows and their implications for economic fluctuations and growth. The appropriate definition (FDI versus debt, public versus private, or net versus gross flows) must be used depending on the question asked.
For example, the neoclassical model predicts a large amount of capital flows based on return differentials from capital-abundant rich countries to capital-scarce poor ones. The lack of such flows in the data is known as the Lucas paradox. The recent period of global imbalances has seen a related paradox, where capital flows in the reverse direction (when measured from current account), from "still poor but growing fast" countries such as China to "rich but not growing" countries such as the United States. Laura Alfaro, Vadym Volosovych, and I have investigated the reasons for both of these phenomena.4
Our results show that in a sample of developed and developing countries, the positive correlation between capital flows and GDP per capita (that is, the Lucas paradox) during 1970-2000 goes away once we account for the effect of institutional quality: rich countries receive more foreign investment because they have better institutions. Exogenous variation in institutional quality, measured by the historical determinants of institutions, is the most important determinant of capital flows, causally explaining the Lucas Paradox.5
If capital is flowing to productive places in the long run, where long-run productivity is proxied by institutional quality, then why do we worry about capital flows from China to the United States, where the latter clearly has higher quality institutions? We worry because the standard models imply that China must have received more capital flows than, say Zimbabwe, in a sample of developing countries, given Chinas faster catch-up productivity growth to the United States. This does not seem to be the case. The fast growing countries accumulate a large amount of reserves and export capital to slow growing countries, causing global imbalances.
In our 2011 paper, we decompose international capital flows into public and private components (private debt, FDI, equity flows versus public flows). We focus on a sample of developing countries since the 1980s and measure the amount of private and public capital flows these countries have received in relation to their catch-up growth. It turns out that upstream flows and global imbalances are manifestations of the same underlying phenomenon: sovereign-to-sovereign flows in the form of government debt from official lenders, reserve accumulation, and aid. International capital flows net of government debt and/or aid are positively correlated with growth. Government debt flows are negatively correlated with growth only if government debt is financed by another sovereign and not by private lenders, where government debt from private lenders also flows in the right direction.
As we document in these works, there is much more nuance to the direction of capital flows than is commonly appreciated. Standard model's predictions are best tested by using private capital flows, because government is outside this model. In relation to figure 1, China had a current account surplus and was a net lender overall. But this is because China is a net lender in what we call sovereign-to-sovereign flows. During the same period, China was a net borrower in terms of private flows, as it should be according to the neoclassical model.
Do Capital Flows Transmit Shocks? Tranquil Times versus Crisis Times
Private capital flows go in the right direction to productive countries but still might bring instability, especially short-term debt flows intermediated via banks. In fact, since the 2008 crisis, global banks have been seen as the "bad guys" who spread the crisis from the United States to other financial systems.
Does financial integration transmit shocks? Academic research has not been helpful in answering this question, because the theory suggests that financial integration may lead to a higher level of business cycle synchronization but can also cause a "decoupling" of business cycles between inter-connected economies. The key issue seems to be the nature of shocks.6
Take for example the case of two integrated economies, where one is hit by a negative shock. If the shock hits the banking sector, then problems in one country will likely spread to the other, as banks operating in both countries pull funds from the non-affected country, making the business cycles of the interlinked countries more synchronized. If, however, the negative shock hits the productivity of firms in a country while banks stay healthy, then return to capital falls and banks pull funds out of the affected country, amplifying the initial shock; this in turn makes the business cycles of financially interconnected economies diverge.
In recent work, Elias Papaioannou, Jose-Luis Peydro, Fabrizio Perri, and I examine the role of banking integration on business cycle synchronization since the 1970s for the OECD countries, explicitly allowing for the possibility that its effect may differ in tranquil versus financial crisis times.7 Our results provide first-time evidence for the above theory.
We document that across country-pairs, there is a significant positive correlation between cross-border banking exposures and output synchronization. This should come as no surprise. The U.S. business cycles are both more synchronized and more financially linked with Canada than with France. There can be many reasons for such a result, including socioeconomic ties and less distance between certain pairs than others.
In sharp contrast to the positive cross-sectional correlation, in examining the within country-pair response of output synchronization to banking integration before the 2008 crisis we find a significantly negative association. This implies that in tranquil times, increases in banking integration within country-pairs over time are associated with more divergent output cycles. The negative association between bilateral financial linkages and business cycle co-movement is in line with the standard models summarized above, where in the absence of financial shocks, banking integration causes divergence in output cycles. Yet, this negative correlation between financial integration and output synchronization turned positive during 2008-10. This result is again in line with the above models showing that during crisis, financial integration facilitates co-movement via contagion.
These findings bridge two bodies of research in international macroeconomics and finance on the implications of financial integration: one looks at its effect on international business cycles and another focuses on financial contagion. The results imply that conduct of monetary policy becomes significantly harder within financially integrated currency areas. Financial integration magnifies output fluctuations across countries, thus making it difficult to conduct monetary policy in all regions. This problem is clearly illustrated nowadays in the euro area.8 The high degree of integration has amplified country-specific shocks, leading to divergence in economic activity between countries of the south and the core; and, as global banks pull capital out of the periphery, the low policy rate of the ECB is not channeled to the south.
Do Capital Flows Bring Growth and Welfare?
The textbook case for supporting international financial integration is well known. In spite of possible contagion during major crisis, integration ultimately will bring growth and welfare. The standard model implies that when capital flows from low return to high return countries, the cost of borrowing will go down, boosting investment and growth. FDI will bring better technology and know-how, together with financial stability, because FDI tends to be long-term, enhancing growth and welfare.
Given the large increase in FDI and portfolio equity flows (Figure 1) during the last decade, it is important to study the effect of such flows on both growth and volatility during tranquil times, for the developed and emerging countries. Using country-level data at the macro level is not appropriate for such a study, because many policy changes occur simultaneously with financial integration, growth, and volatility. That makes the identification of the individual effects harder.
In joint work, Bent Sorensen, Volosovych, and I use a novel dataset of firm-level balance sheets and foreign investment from 25 European countries for the period 1996-2006 (AMADEUS) to study the effect of foreign direct investment and portfolio equity investment on output volatility.9 Our dataset differs starkly from Compustat or Worldscope-type data, because in our data 99 percent of the firms are privately held. We document a positive, highly robust, relationship between firm-level foreign investment and output (value added) volatility in cross-section and over time, both for emerging and developed Europe.
One theory that can explain this stylized fact is as follows: foreign investment brings technology and know-how to the target firm and improves diversification of ownership of capital. After receiving investments from multinationals, target firms might chose to invest in risky but high return projects that jointly increase their productivity and output volatility. 10 In joint work, Chris Fons-Rosen, Sorensen, Volosovych, Carolina Villegas-Sanchez, and I ask whether firms that receive foreign investment are becoming more productive and whether they create spillovers for domestic firms. 11 Notice that spillover effects from foreign to domestic firms are essential to realizing any aggregate effects of foreign investment, and they are the main reason behind the big policy push for FDI over last two decades. We extend our firm-level data to 60 countries worldwide (ORBIS), where we have more than 30 million shareholder/subsidiary links with sector and nationality of the investor.
Selection is a problem. Multinationals are likely to buy local firms with high future growth potential. Foreign firms may select themselves into high productivity sectors and drive weak domestic firms out of business. In such a case, domestic firms in the foreign activity sector might become more productive on average, but not because any single firm has become productive. Since our data encompasses many countries and sectors, we can control selection through the use of firm and sector-year effects. By exploiting the difference between financial and industry investment as exogenous variation, we control dynamic selection at the firm level.
Our results show that the positive correlation between foreign investment and productivity growth in developed countries is driven by selection. Multinationals target more productive companies but do not contribute to further increases. In emerging markets, there is evidence of productivity enhancing effects of multinationals on targets but the effects are small. For domestic firms, in both developed and emerging countries there are negative spillover effects from direct competitors. Only domestic firms with high initial productivity and suppliers of foreign owned firms benefit from knowledge spillovers. The effects are too small to contribute to aggregate productivity.Summary
Overall, my research shows that the neoclassical model is alive and well in terms of predicting where and why capital should flow if we measure capital flows as private flows (FDI, portfolio equity and private debt). When it comes to the effects of capital flows in terms of further increases in productivity and knowledge spillovers, these are harder to find. Most of the positive correlations between foreign investment and growth at the aggregate level initially are explained by the fact that foreign capital is attracted to high productivity firms, sectors, and countries. Firm heterogeneity in terms of foreign investment and initial productivity are important for the realization of positive effects of FDI on productivity at the disaggregated level.
* Kalemli-Ozcan is an NBER Research Associate and a Professor of Economics at the University of Maryland.
1. Notes: The data is from IMF, IFS. Net capital flows represent average net flows of FDI and portfolio equity investment, and debt (portfolio debt investment and other investment) divided by nominal GDP in current dollars, based on WB and IMF data and corresponding to the sum of the flows of assets (outflows) and liabilities (inflows), because assets have a minus sign as BOP convention. Total capital flows are represented by the negative of total current account flows. The data for current account is available for 186 countries; the data for FDI and portfolio flows and debt flows is available for 179 and 178 countries respectively, varying across years. FDI assets and liabilities correspond respectively to Direct Investment Abroad (line 78bdd) and Direct Investment in Reporting Economy (line 78bed). They include equity capital, reinvested earnings, other capital, and financial derivatives associated with various intercompany transactions between affiliated enterprises. Portfolio Equity Investment assets and liabilities correspond to Equity Securities Assets (line 78bkd) and Equity Securities Liabilities (line 78bmd). They include shares, stock participations, and similar documents that usually denote ownership of equity. Debt assets and liabilities include Debt Security Assets (line 78bld) and Debt Security Liabilities (line 78bnd), which include bonds and money market or negotiable debt instruments; Other Investment Assets (line 78bhd); and Other Investment Liabilities (line 78bid), which include all financial transactions not covered by direct investment, portfolio investment, financial derivatives, or other assets. The current account total corresponds to the Current Account excluding Exceptional Financing (line 78ald).
2. This pattern of "borrowing from space" is related to the fact that countries' liabilities are better measured relative to their assets.
3. If we divide the sample between rich and poor countries -- where "rich" is defined as GDP per capita higher than 15,000 USD in 2000 dollars on average throughout the period -- we see that poor countries receive more capital flows than rich, with a 5 percent current account deficit relative to a zero balance for the rich, on average. But this is not true when we look at FDI and equity investment, where poor countries receive less. Gross flows (sum of assets and liabilities) amount to 150 percent of GDP for rich countries and 25 percent of GDP for poor countries, on average.
4. L. Alfaro, S. Kalemli-Ozcan, and V. Volosovych, "Why does not Capital Flow from Rich to Poor Countries? An Empirical Investigation", NBER Working Paper No. 11901, December 2005, published in Review of Economics and Statistics, 90, 2008, pp. 347-68, and "Sovereigns, Upstream Capital Flows, and Global Imbalances", NBER Working Paper No. 17396, September 2011.
5. We used settler mortality rates to account for endogenous institutions, based on work by D. Acemoglu, S. Johnson, and J. Robinson in "The Colonial Origins of Comparative Development: An Empirical Investigation", American Economic Review, 91, (2001), pp. 1369-1401.
6. Most theoretical works focus on one type of shock, that is, either tranquil times or financial crises. For theoretical models where both mechanisms are in place, see B. Holmsrom and J. Tirole, "Financial Intermediation, Loanable Funds, and the Real Sector", Quarterly Journal of Economics, 112, 3, (1997), pp. 660-91; F. Perri and V. Quadrini, "International Recessions", NBER Working Paper No. 17201, July 2011, and S. Kalemli-Ozcan, E. Papaioannou, and F. Perri , "Global Banks and Crisis Transmission", NBER Working Paper No. 18209, July 2012, forthcoming in Journal of International Economics.
7. S. Kalemli-Ozcan, E. Papaioannou, and J. Peydro , "Financial Globalization, Financial Regulation, and the Synchronization of Economic Activity", NBER Working Paper No. 14887, April 2009, forthcoming in Journal of Finance, 2012; S. Kalemli-Ozcan, E. Papaioannou, and F. Perri, "Global Banks and Crisis Transmission", NBER Working Paper No. 18209, July 2012, and forthcoming in Journal of International Economics.
8. See R. Mundell, "A Theory of Optimum Currency Areas", American Economic Review, 51, 4, (1961), pp.657-65, for the classical treatment of the issue.
9. S. Kalemli-Ozcan, B. Sorensen, and V. Volosovych, "Deep Financial Integration and Volatility", NBER Working Paper No. 15900, April 2010.
10. This argument is detailed in M. Obstfeld, "Risk-Taking, Global Diversification and Growth", American Economic Review, 84, 5, (1994), pp. 1310-29, and D. Acemoglu and F. Zilibotti, "Was Prometheus Unbound by Chance? Risk, Diversification, and Growth", Journal of Political Economy, 105, 4, (1997), pp. 709-51, who show how diversified capital ownership allows firms to choose riskier projects leading to higher growth and volatility.
11. C. Fons-Rosen, S. Kalemli-Ozcan, B. Sorensen, V. Volosovych, and C. Villegas-Sanchez, "Quantifying Productivity Gains from Foreign Investment", forthcoming as an NBER Working Paper.