NBER Reporter 2012 Number 1: Research Summary
Inflation Forecasting
James H. Stock and Mark W. Watson *
Forecasting inflation is one of the core responsibilities of economists at central banks and in the private sector, and models of inflation dynamics play a central role in determining monetary policy. In this light, it is not surprising that there is a long and rich literature on inflation dynamics and inflation forecasting.
A recurring theme in this literature is the usefulness – or not – of the Phillips curve as a tool for forecasting inflation. Phillips 1 originally documented an inverse relation between the rates of wage inflation and unemployment in the United Kingdom. Samuelson and Solow 2 extended "Phillips' curve" to U.S. data and to price inflation. The Phillips curve remains at the core of modern specifications, which additionally include expectations of inflation, often use activity variables other than the unemployment rate, and incorporate sluggish inflation dynamics. Indeed, the central price determination equation in modern dynamic stochastic general equilibrium models, the New Keynesian Phillips Curve, is a direct descendant of the original Phillips curve, augmented to incorporate forward-looking inflation expectations and with a real activity measure serving as a proxy for real marginal cost.
This research summary reviews our work of the past fifteen years on inflation forecasting using small, stand-alone models. Most of this work revolves around the use of real economic activity to forecast inflation, to which we refer broadly as Phillips curve models, although other forecasting frameworks (such as incorporating monetary aggregates) are also considered.

Our research on inflation forecasting and inflation dynamics leads us to two broad conclusions. First, there are important regularities in the inflation-output relation. In particular, in the postwar United States, recessions are times of disinflation. This regularity was behind the deflation scares of 2002-3 and 2009-10. Figure 1 plots the rate of unemployment and the four-quarter rate of core PCE inflation for six U.S. slumps from 1960 to the present, labeled by the NBER-dated cyclical peak. The plotted rates are deviated from their values at the respective NBER-dated peak; the vertical axis is scaled so that all recessions have the same increase in the unemployment rate; and the horizontal axis is scaled so that the total time span is twice the time between the start of the recession and the peak of the unemployment rate. The mean paths of the unemployment rates and inflation are shown as dashed lines, and the dotted lines are one standard deviation bands 3 . Over these six recessions and recoveries, by the time the unemployment rate peaks, inflation has fallen on average by 0.37 percentage points for each percentage point increase in the rate of unemployment.
Second, we conclude that despite this evident regularity, inflation dynamics and inflation forecasting models exhibit considerable instability. Such instability is unsurprising, given the substantial changes in monetary policy, unionization, globalization, and other aspects of the U.S. economy that are relevant to price-setting. Indeed, Figure 1 suggests one important aspect of this instability: the rate of inflation fell by less following the NBER-dated peaks of 2001Q1 and 2007Q2 than it did on average during earlier the previous five recessions. A leading explanation for the more muted response of inflation over the two recent recessions is that monetary policy has succeeded in anchoring inflationary expectations. However, because both disinflationary episodes started at low levels, another candidate explanation is resistance to nominal wage declines.
Time Variation in Inflation Forecasting Models
The first step towards handling instability is admitting that you have a problem. Providing formal statistical evidence of instability entails the use of a variety of methods, including tests for in-sample breaks, tests for breaks at the end of the sample, and pseudo out-of-sample forecast comparisons. We have undertaken such analyses in a number of studies over the past fifteen years; while forecasting models for other macroeconomic variables also exhibit structural instability 4 , relations involving inflation are particularly problematic. This instability extends beyond Phillips Curve models, indeed models using asset prices 5 or monetary aggregates 6 appear even more unstable than ones based on aggregate activity.
In a 2008 paper, we showed that there are some meaningful patterns in the instability of the output-inflation relation 7. In particular, the performance of Phillips curve forecasts is episodic: as Atkeson and Ohanian forcefully demonstrated 8, it was quite difficult to best naïve univariate forecasting models during much of the Great Moderation period. But, as suggested by Figure 1, Phillips curve forecasts add value during recessions and their aftermath.
The Time-Varying NAIRU
In earlier work, we focused on time variation that entered through movements in the NAIRU (the non-accelerating inflation rate of unemployment). 9 The NAIRU is the rate of unemployment at which there is no tendency for the inflation rate to increase or to decrease, and the unemployment gap is the deviation of the unemployment rate from the NAIRU. The NAIRU plausibly changes over time because of changes in demographics, in methods of job search, and in other features of the U.S. economy. A time-varying NAIRU can be estimated by introducing time variation into the intercept of a Phillips curve. In a series of papers, we developed methods for estimating a time-varying NAIRU 10 , 11 , and its standard error, and these methods were used and further developed by Robert J. Gordon12 and others. One flexible method is to model the NAIRU as an unobserved, or latent, process that follows a random walk. In related methodological work, we developed methods for estimating the variance parameter governing the magnitude of the innovations for this random walk 13.
Empirically, we found that there has been considerable variation in the NAIRU in the United States over the past fifty years. Confidence intervals for the NAIRU are quite wide, typically exceeding plus or minus one percentage point of unemployment. These intervals are widest towards the end of the sample because we do not have the data on future inflation needed to pin down today’s NAIRU.
The unemployment rate is only one measure of economic activity. This observation raises the question of which of the many candidate measures of economic activity one should use for inflation forecasting. One approach is to use very many such predictors, but with statistical discipline that avoids over-fitting. To this end, we developed a dynamic factor model (a method for handling high-dimensional datasets particularly well suited to macroeconomic data) to construct an activity index for forecasting inflation14. The Chicago Fed currently produces and publishes this monthly index of 85 activity variables as the Chicago Fed National Activity Index (CFNAI)15 .
Time-varying Expectations Anchoring
In addition to time variation arising from an evolving NAIRU, the persistence of U.S. inflation varies over time. This is consistent with the notion suggested by Figure 1 that inflation expectations have been better anchored over the past decade than earlier. We found that this changing persistence can be captured in a simple parsimonious univariate time-series model that performs well across different inflation regimes16 . According to the model, unexpected changes in the rate of inflation during the 1970s and early 1980s were quickly incorporated into inflationary expectations. In contrast, during the past 15 years inflation expectations, and thus inflation itself, have responded far more sluggishly to an inflation surprise.
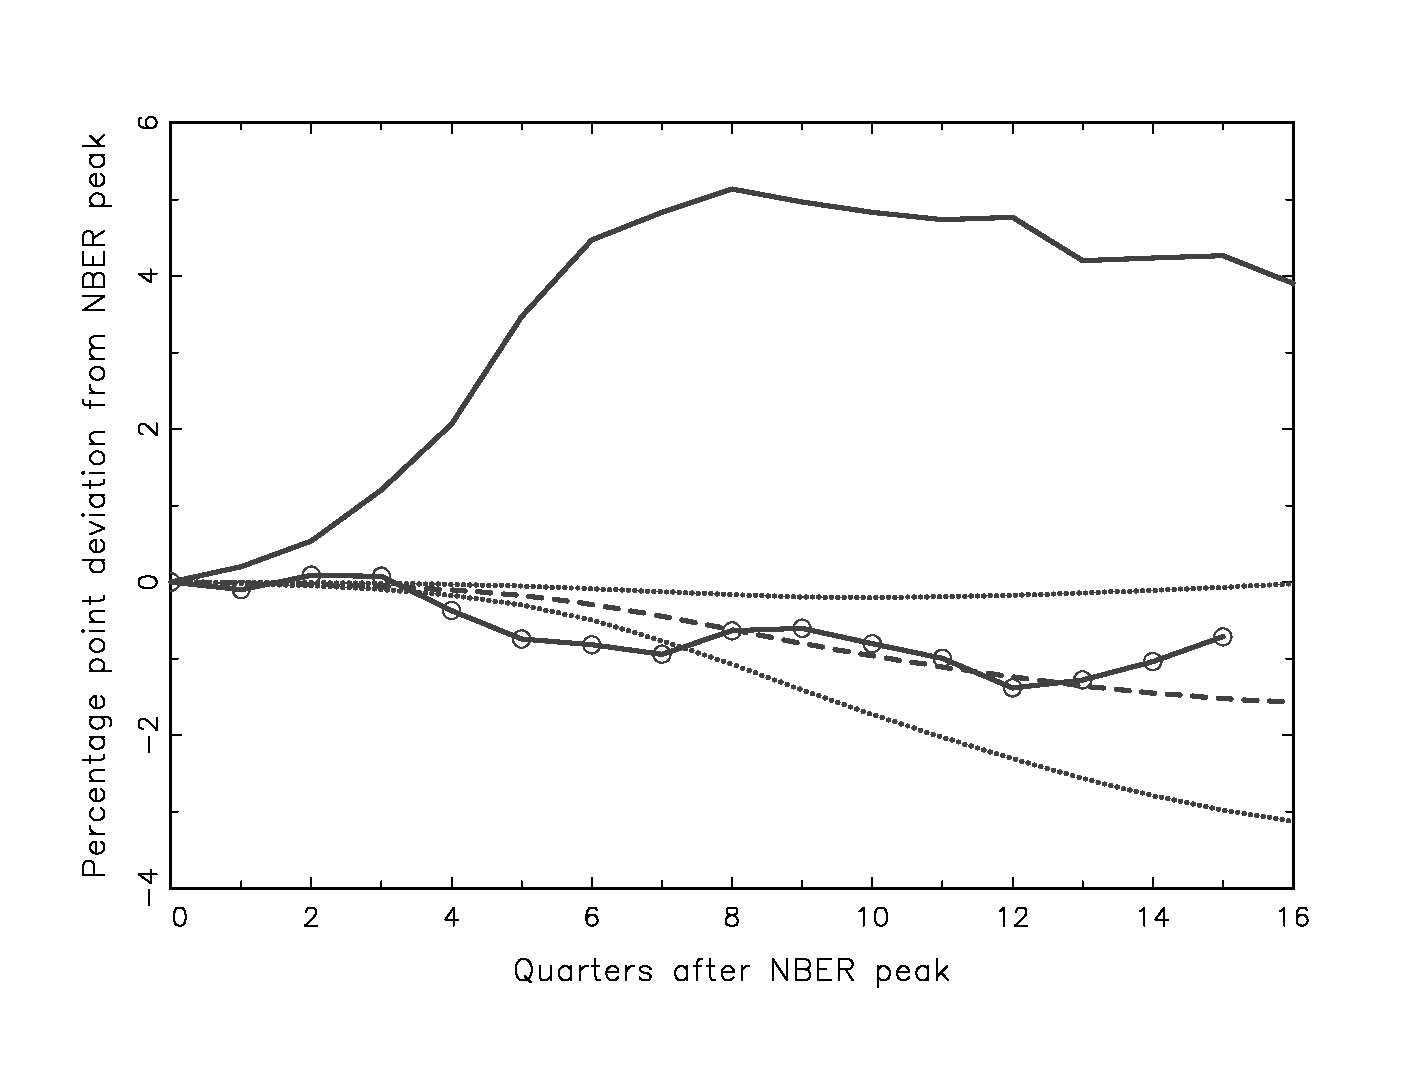
When this univariate model of time-varying expectations anchoring is merged with measures of economic activity, the result is a Phillips curve in which the dynamic effect on inflation of an exogenous change in activity depends on the degree of expectations anchoring. Figure 2 (which extends Figure 14 in Stock and Watson, 2010) shows a dynamic simulation of a Phillips curve model (dashed line) using a “recession unemployment gap” and a single standard error confidence band (dotted lines). The model parameters used to compute the predicted path and standard error bands date from August 2010, while the actual data are through 2011Q4 for unemployment and 2011Q3 for core PCE inflation, so the final five quarters of the plot in Figure 2 provide a true out-of-sample test of the model. In the published model, strong expectations anchoring leads to muted disinflation during slumps. As can be seen in Figure 2, this model captures the modest disinflation we experienced subsequent to the 2007Q4 recession.
Ongoing Research Questions
Many important questions remain. One is how to develop a single Phillips curve forecasting model with explicit time variation, with the goal of outperforming univariate models during recessionary episodes and performing at least as well otherwise. In current work, Stella and Stock make some positive steps towards this goal17.
An important remaining question is whether we can ascertain why the disinflations following the 2001Q1 and 2007Q4 recessions were so muted. The easy answer is anchored expectations and greater confidence in the conduct of monetary policy. It is, however, incumbent on researchers to question the easy answers and to rule out other proximate, coincidental causes, such as exchange rate movements (as occurred in 2003-4) and energy price increases (as occurred in 2010-11). Our work on these and related issues of inflation forecasting and inflation dynamics is ongoing.
* Stock and Watson are Research Associates in the NBER's Program on Economic Fluctuations and Growth and members of the NBER's Business Cycle Dating Committee. Stock is also the Harold Hitchings Burbank Professor of Political Economy in Harvard University's Economics Department. Watson is the Howard Harrison and Gabrielle Snyder Beck Professor of Economics and Public Affairs at Princeton University.
1. A.W. Phillips, "The Relation Between Unemployment and the Rate of Change of Money Wage Rates in the United Kingdom, 1861–1957," Economica, 25, 1958, pp. 283–99.
2. P.A. Samuelson and R.M. Solow, "Analytical Aspects of Anti-Inflation Policy," American Economic Review, Papers and Proceedings, 50, 1960, pp. 177–94. The history of the Phillips curve is reviewed in R.J. Gordon, "The History of the Phillips Curve: Consensus and Bifurcation," Economica 78, 2011, pp. 10-50.
3. Figure 1 merges the recessions beginning in 1980Q1 and 1981Q3 because of the brevity of the 1980Q1 recession, and omits the 1973Q4 recession, which saw an initial increase in inflation because of the oil price shock. Figure 1 is an updated version of Figure 2 in J.H. Stock and M.W. Watson, "Modeling Inflation after the Crisis," NBER Working Paper No. 16488, October 2010, and in "Macroeconomic Policy: Post-Crisis and Risks Ahead," Proceedings of the Federal Reserve Bank of Kansas City, 2010 Jackson Hole Symposium.
4. J.H. Stock and M.W. Watson, "Evidence on Structural Instability in Macroeconomic Time Series Relations," NBER Technical Working Paper T0164, September 1994, and Journal of Business and Economic Statistics, 14 (1996), pp. 11-30.
5. J.H. Stock and M.W. Watson, "Forecasting Output and Inflation: The Role of Asset Prices," NBER Working Paper No. 8180, March 2001, and Journal of Economic Literature 41 (2003), pp. 788 – 829.
6. R. King, J.H. Stock, and M.W. Watson, "Temporal Instability of the Unemployment-Inflation Relation," Economic Perspectives, Federal Reserve Bank of Chicago (May/June 1995), pp. 2-12.
7. J.H. Stock and M.W. Watson, "Phillips Curve Inflation Forecasts," NBER Working Paper No. 14322, September 2008, and Ch. 3 in Understanding Inflation and the Implications for Monetary Policy, J. Fuhrer, Y. Kodrzycki, J. Little, and G. Olivei, eds., Cambridge: MIT Press, 2009.
8. A. Atkeson and L.E. Ohanian, "Are Phillips Curves Useful for Forecasting Inflation?" Federal Reserve Bank of Minneapolis Quarterly Review 25(1)(2001), pp. 2-11.
9. D. Staiger, J.H. Stock, and M.W. Watson, "How Precise Are Estimates of the Natural Rate of Unemployment?" NBER Working Paper No. 5477, March 1996, and in C. Romer and D. Romer, eds., Reducing Inflation: Motivation and Strategy, University of Chicago Press for the NBER, 1997, pp.195-242.
10. R. D. Staiger, J.H. Stock, and M.W. Watson, "The NAIRU, Unemployment, and Monetary Policy," Journal of Economic Perspectives, 11 (Winter 1997), pp. 33-51.
11. D. Staiger, J.H. Stock, and M.W. Watson, "Prices, Wages and the U.S. NAIRU in the 1990s," NBER Working Paper No. 8320, June 2001, and Ch. 1 in The Roaring Nineties, A. Krueger and R. Solow, eds., Russell Sage Foundation/The Century Fund: New York (2001), pp. 3 – 60.
12. R.J. Gordon, "Foundations of the Goldilocks Economy: Supply Shocks and the Time-Varying NAIRU," Brookings Papers on Economic Activity 1998:2, pp. 297-333.
13. J.H. Stock and M.W. Watson, "Median Unbiased Estimation of Coefficient Variance in a Time Varying Parameter Model," NBER Technical Working Paper No. T0201, August 1996, and Journal of the American Statistical Association, 93 (1998), pp. 349-58.
14. J.H. Stock and M.W. Watson, "Forecasting Inflation," NBER Working Paper No. 7023, March 1999, and Journal of Monetary Economics 44, no. 2, (1999), pp. 293-335.
15. http://www.chicagofed.org/webpages/publications/cfnai/index.cfm.
16. J.H. Stock and M.W. Watson, "Why Has Inflation Become Harder to Forecast," NBER Working Paper No. 12324, June 2006, and Journal of Money, Credit, and Banking, 39 (2007), pp. 3-34.
17. A. Stella and J.H. Stock, "State-Dependent Models for Inflation Forecasting," manuscript, Harvard University, (2011).