In this Issue

The Retirement Income Choices of Defined Contribution Plan Participants
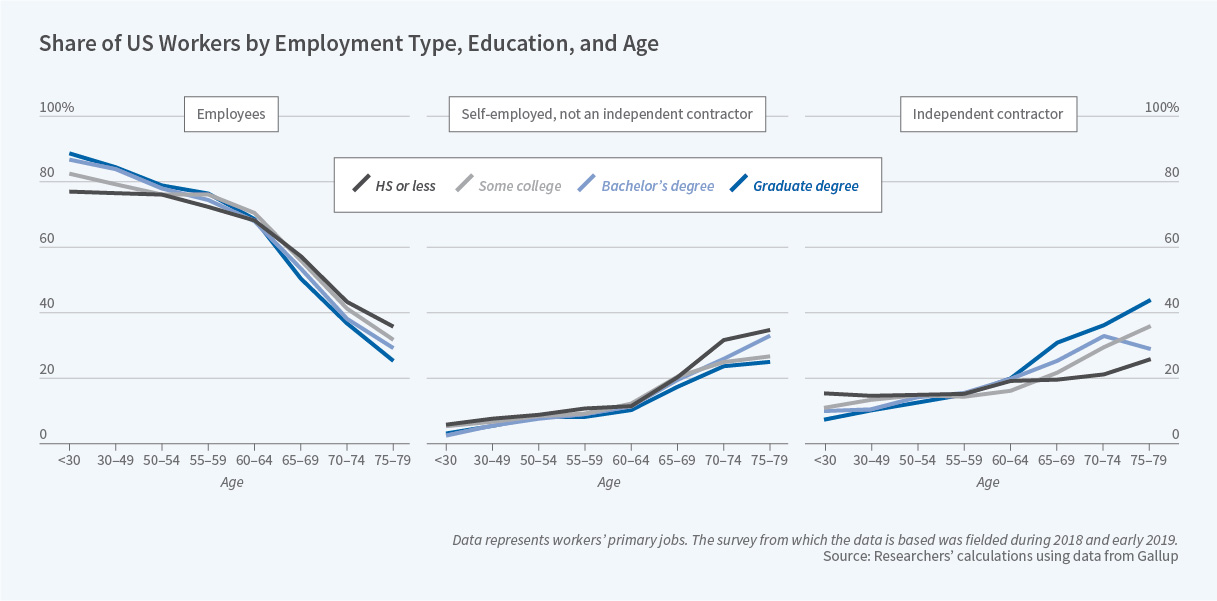
Self-Employment at Older Ages

Q & A with New RDRC Co-Director Dr. James Choi
The Bulletin on Retirement and Disability summarizes selected recent Working Papers. It is distributed digitally to economists and other interested persons for informational and discussion purposes. The Bulletin is not copyrighted and may be reproduced freely with attribution of source.
Working Papers produced as part of the NBER's research program are distributed to make preliminary research results available to economists in the hope of encouraging discussion and suggestions for revision before final publication. Neither Working Papers nor issues of the Bulletin on Retirement and Disability are reviewed by the Board of Directors of the NBER.
The Bulletin on Retirement and Disability is edited by Courtney Coile.
To subscribe to receive new issues of the Bulletin on Retirement and Disability, please click here.
To unsubscribe please
click here.
Trends in Retirement Income Adequacy
The question of whether the retirement income of older Americans is adequate to maintain their pre-retirement standard of living is a matter of public concern and debate. Some analysts point to a decline in defined benefit pensions, falling real interest rates, and low savings rates as serious threats to the economic security of older Americans. Others argue that there is no retirement savings crisis, pointing to a falling poverty rate among older Americans and rising median income at older ages.
In Trends in Retirement Income Adequacy: Evidence from IRS Tax Data, (NBER RDRC Working Paper 19-06), researchers
John Beshears,
James Choi,
David Laibson, and
Shanthi Ramnath explore this question using tax records from the IRS.
The dataset compiled by the authors includes tax returns for the years 2000 to 2016 for a 5 percent sample of taxpayers born between 1930 and 1941. These data include both self-reports and third-party information on income sources including wages, business income, Social Security benefits, distributions from pension plans, taxable and tax-exempt interest, and capital gains and dividend income, among others. These data do not capture sources of income that are not included in tax records, including Supplemental Security Income and Veterans Affairs benefits. The authors use these data to construct a measure of "equivalent" household income that adjusts for the fact that married households need less than twice as much income as single-person households to enjoy the same level of well-being.
The first finding is that the pre-tax household equivalent income of people at age 70 rose across the entire income distribution between 2000 and 2011. Households at the median saw pre-tax income rise from $30,710 to $33,908, while those at the 25th percentile saw an increase from $15,341 to $17,225 and those at the 75th percentile saw an increase from $51,360 to $56,522 (in inflation-adjusted terms). The rate of growth was in fact quite similar across the income distribution — 10.5 percent at the 10th percentile, 12.3 percent at the 25th percentile, 10.4 percent at the median, 10.1 percent at the 75th percentile, and 8.7 percent at the 90th percentile. The pattern for after-tax income is comparable.
At age 80, however, there has been an increase in inequality over time. From 2010 to 2016, pre-tax income rose by 5.0 percent at the median, by 8.4 percent at the 75th percentile, and by 12.2 percent at the 90th percentile. By contrast, pre-tax income fell by 0.8 percent at the 25th percentile and by 6.6 percent at the 10th percentile. Interestingly, the tax system did little to alleviate the rise in inequality, as evident from the similar pattern in after-tax income.
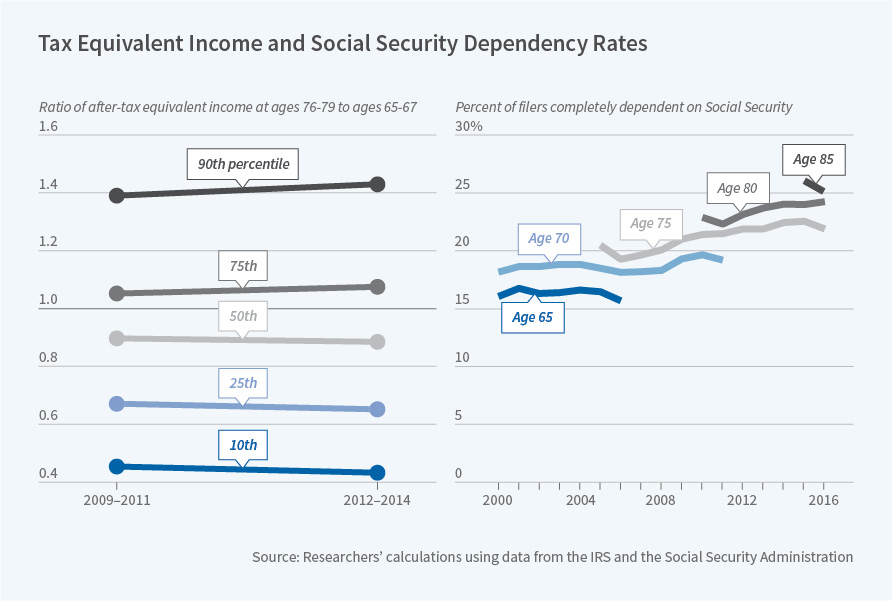
Next, the authors explore households' ability to maintain their pre-retirement standard of living by looking at the income replacement ratio, defined as equivalent after-tax real income over ages 76 to 79 relative to the same measure over ages 65 to 67. This ratio has been flat or rising over time for households with income at or above the median but has deteriorated for households below the median.
Also of interest is the extent to which households are completely dependent on Social Security for their retirement income, defined here as having less than $100 of non-Social Security income and no IRA balances. The share of households in this state rose from 18.2 to 19.2 percent for 70-year-olds and from 22.9 to 24.2 percent for 80-year-olds (over the same age ranges noted above).
Finally, the authors examine the fraction of households that receive pension income, either in the form of a defined benefit payout or a defined contribution withdrawal. This share has remained relatively constant over time, averaging about 65 percent for seventy-year-olds and 69 percent for eighty-year-olds.
Overall, the findings "paint a mixed picture of how retirement income adequacy has evolved for Americans in the 21st century." There has been an increase in inequality of income at age 80, but not at age 70. While the receipt of pension income has remained steady over time, the fraction of households that are completely dependent on Social Security has increased. As the authors note, the latter group of households has limited ability to accommodate expenditure shocks and appears to have either outlived their savings or never accumulated much to begin with. The authors conclude, "the fact that the prevalence of these households has been rising may be the most concerning finding in this paper."
This research was supported by the U.S. Social Security Administration through grant # RDR18000003-01 to the National Bureau of Economic Research as part of the SSA Retirement and Disability Research Consortium. The findings and conclusions expressed are solely those of the author(s) and do not represent the views of SSA, any agency of the Federal Government, or the NBER.
